RETAIL
- The retail trade trend series was suspended in November 2008 as it is not possible to determine the trend in retail turnover for the period affected by the government's economic stimulus packages and other influences associated with global economic conditions.
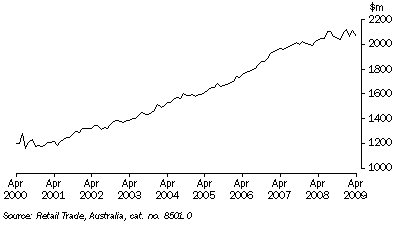
- In seasonally adjusted terms, monthly retail turnover in Western Australia decreased by 2.4% in April 2009 following an increase (2.2%) in March 2009.
- While there were small fluctuations in the seasonally adjusted data through the year, monthly retail turnover in Western Australia has not fallen below $2 billion since February 2008. The government's stimulus packages may have had some effect in maintaining relatively high turnover.
- The April 2009 decrease in turnover was spread across all major retail trade groups, except household goods (up $19 million). Department stores (down $21 million) and clothing and soft goods retailers (down $12 million) were among those that experienced larger decreases in retail turnover in the month of April.
Monthly Retail Turnover, Current prices
- Seasonally adjusted

1 Retail Trade(a), Monthly turnover - Current prices: All series |
|
 |  | Food | Dept
stores | Clothing &
soft good | Household
good | Other
retail | Cafes &
restaurants(b) | Total |
Seasonally adjusted ($m) |
|
| 2008 |  |  |  |  |  |  |  |
 | April | 757.2 | 174.4 | 146.7 | 352.7 | 326.7 | 281.3 | 2 038.9 |
 | May | 769.2 | 172.1 | 144.9 | 353.3 | 330.1 | 279.4 | 2 049.1 |
 | June | 770.7 | 168.8 | 142.5 | 355.1 | 327.9 | 286.1 | 2 051.1 |
 | July | 801.0 | 181.7 | 143.2 | 361.4 | 328.6 | 286.4 | 2 102.4 |
 | August | 814.9 | 173.6 | 138.9 | 360.2 | 327.3 | 289.8 | 2 104.7 |
 | September | 799.2 | 178.8 | 133.8 | 347.0 | 321.3 | 284.4 | 2 064.5 |
 | October | 796.9 | 174.7 | 124.6 | 346.1 | 319.8 | 286.5 | 2 048.6 |
 | November | 812.0 | 166.6 | 120.6 | 341.5 | 315.2 | 284.1 | 2 040.0 |
 | December | 805.7 | 181.3 | 128.3 | 381.2 | 333.4 | 266.9 | 2 096.7 |
| 2009 |  |  |  |  |  |  |  |
 | January | 845.3 | 185.6 | 124.8 | 366.4 | 336.8 | 266.8 | 2 125.7 |
 | February | 835.5 | 161.7 | 124.7 | 351.0 | 316.7 | 278.6 | 2 068.3 |
 | March | 830.0 | 186.6 | 134.7 | 352.3 | 326.1 | 284.4 | 2 114.1 |
 | April | 812.0 | 165.4 | 122.8 | 371.2 | 309.3 | 283.2 | 2 064.0 |
|
| (a) For industry definitions see paragraph 6 of the Explanatory Notes in the source publications. |
| (b) Includes takeaway food services. |
| Source: Retail Trade, Australia, cat. no. 8501.0. |
| Note: As of July 2008, all historical data have been revised as a result of changes to the survey design. |
To view Excel spreadsheet:
Retail Trade
 Print Page
 Print All
 Print Page
 Print All