BUILDING APPROVALS
NOVEMBER KEY FIGURES, Western Australia |
|
 | Nov 2010 | Oct 2010 | Nov 2009 |
| Dwelling units approved | no. | no. | no. |
|
| Trend estimates | 1 806 | 1 783 | 2 186 |
| Seasonally adjusted estimates | 1 898 | 1 772 | 1 996 |
|
Source: Building Approvals, Australia (cat. no. 8731.0).
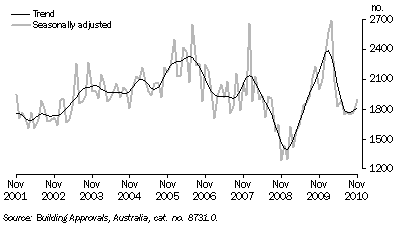
- In November 2010, the trend estimate for dwelling units approved rose slightly in WA for the third consecutive month but was 17% lower than in November 2009. This compared with a 10% fall nationally over the same 12 month period.
- WA was one of only two states to record an increase in trend terms (1.3%) from the previous month, while nationally the trend estimate fell 0.4%.
- For private sector housing, there was a small decrease (-1.1%) in the monthly trend estimate. This was the tenth consecutive monthly fall in private sector approvals in WA, which mirrored the Australian trend.
Total Dwelling Units Approved

- After years of relatively small movement in the monthly trend estimate, the number of dwelling units approved in WA fell steeply through 2008, dropping by a third to a low of 1,400 in January 2009. Driven by falling interest rates, increased government subsidies and social housing initiatives, introduced in response to the global financial downturn, the number of dwelling approvals then made a rapid recovery through the 2009 calendar year.
- After peaking in early 2010, approvals declined again as the residential building market reacted to rising interest rates and the end of the First Home Owner's Boost. Although there were signs of a recovery in the last three months, building approvals in November 2010 remained lower, in trend terms, than at any time in the six years prior to the GFC.
This link takes you to time series spreadsheets from
Building Approvals, Australia, Nov 2010 (cat. no. 8731.0). Table 05 contains Number of Dwellings Approved by Sector for Western Australia.
 Print Page
 Print All