GRAPHS
Secured housing finance commitments to individuals, (from Table 8.2)
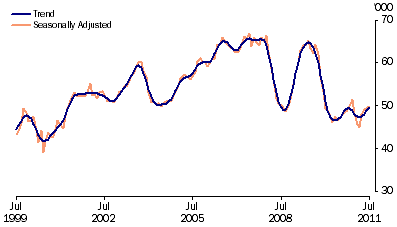 Source: Housing Finance, Australia, (cat. no. 5609.0)
Personal finance commitments, (from Table 8.3) Change from previous month
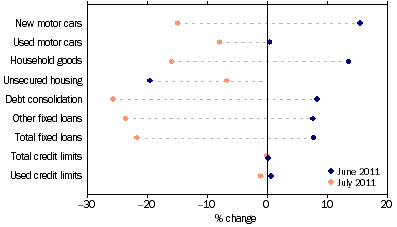
Source: Lending Finance, Australia, (cat. no. 5671.0)
Commercial and lease finance commitments, (from Table 8.4) Change from previous month
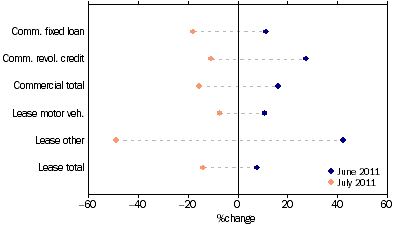
Source: Lending Finance, Australia, (cat. no. 5671.0)
Key interest rates, (from Table 8.5)
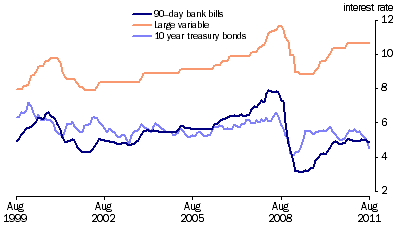
Source: Reserve Bank of Australia Bulletin, (RBA)
Trade weighted Index, (from Table 8.6) - May 1970 = 100.0
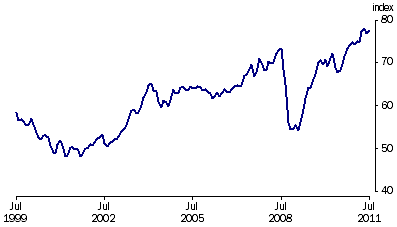
Source: International Trade in Goods and Services, Australia, (cat. no. 5368.0)
Australian stock market indexes, (from Table 8.7)
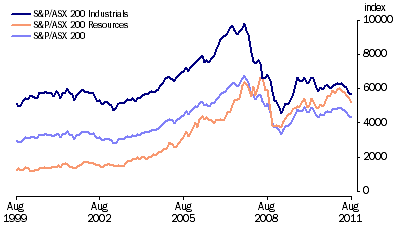
Source: Australian Stock Exchange ASX
Credit market outstandings, (from Table 8.8) Non-Financial domestic sector: March Quarter 2011
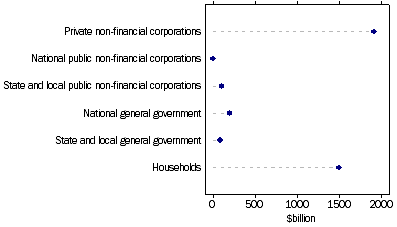
Source: Australian National Accounts: Financial Accounts, (cat. no. 5232.0)
Demand for credit by, (from Table 8.8) Non-financial domestic sector: March Quarter 2011
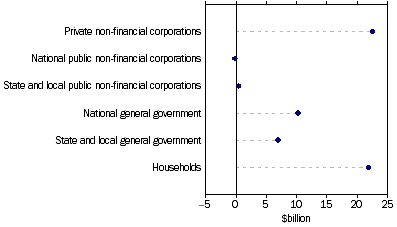
Source: Australian National Accounts: Financial Accounts, (cat. no. 5232.0)
 Print Page
 Print Page