COMMUNITY PARTICIPATION
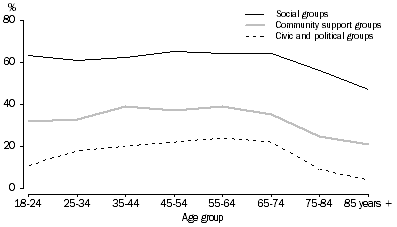
People also participate directly in the community through a wide range of social and other types of groups. In 2010, 63% of people had actively participated in one or more social groups during the last 12 months, 35% in community support groups and 19% in civic and population groups. There was some variation in participation according to age (see graph 4.2). The rate of participation in social groups was between 60% and 65% for all age groups up to 65-74 years, declining to 56% for those aged 75-84 and 47% of those aged 85 years and over. Participation in civic and political groups generally increased with age until the age group 55-64 years where participation peaked at 24% (table 29).
4.2 Active participation in groups in the last 12 months, by age

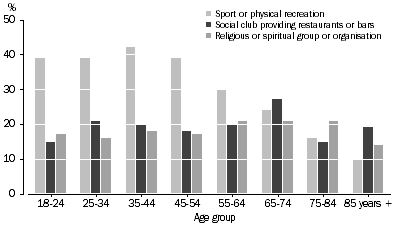
The most popular types of social participation that adults took part in were sport and recreation groups (35%), followed by social clubs providing restaurants or bars (20%) and religious or spiritual groups (18%). Sport and recreation groups were the most common form of community participation in the younger age groups, with participation in clubs and religious groups increasing in relative significance for older age groups.
4.3 Types of groups participated in, in the last 12 months, by age

 Print Page
 Print All