GOVERNMENT FINANCE STATISTICS
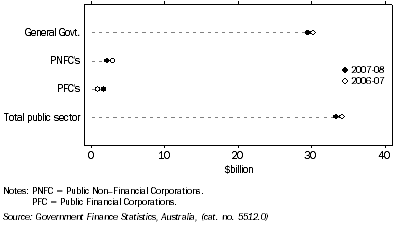
GFS Net operating balance, (from Table 1.7) Total public sector
- 2006-07 and 2007-08

All Australian Governments, Government Finance Statistics |
|
 | GFS Net Operating Balance | GFS Net Lending(+)/Borrowing(-) |
| Period | General Government | Public non-financial corporations | Public financial corporations | Total public sector | General Government | Public non-financial corporations | Public financial corporations | Total public sector |
Annual ($ million) |
|
| 2005-06 | 28 163 | -560 | 765 | 28 447 | 18 990 | -9 485 | 734 | 10 555 |
| 2006-07 | 30 277 | 2 934 | 883 | 34 230 | 17 243 | -8 546 | 721 | 9 625 |
| 2007-08 | 29 512 | 2 169 | 1 703 | 33 355 | 14 505 | -12 998 | 1 589 | 3 292 |
|
| Source: Government Finance Statistics, Australia, (cat. no. 5512.0) and Public Finance Section. |
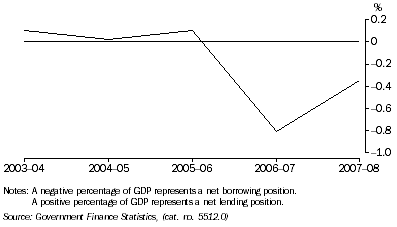
Total public sector, (from Table 1.7) Net lending/borrowing as a percentage of GDP

All Australian Governments, Government Finance Statistics balance sheet - as at 30 June 2007 |
|
 | General Government | Public non-financial corporations | Public financial corporations | Total Public Sector |
 | 2006-07 | 2007-08 | 2006-07 | 2007-08 | 2006-07 | 2007-08 | 2006-07 | 2007-08 |
Annual ($ million) |
|
| Total assets | 1 081 101 | 1 240 323 | 279 729 | 307 339 | 295 511 | 280 213 | 1 297 219 | 1 483 096 |
| Total liabilities | 366 844 | 377 765 | 96 421 | 101 325 | 273 826 | 261 283 | 582 962 | 620 538 |
| Shares and other contributed capital | 0 | 0 | 183 308 | 206 015 | 21 686 | 18 929 | - | 0 |
| GFS Net worth | 714 257 | 862 558 | 0 | 0 | 0 | 0 | 714 257 | 862 558 |
| Net debt | -71 757 | -81 946 | 45 743 | 52 098 | -41 411 | -38 674 | -67 426 | -68 522 |
|
| - nil or rounded to zero (including null cells) |
| Source: Government Finance Statistics, Australia, (cat. no. 5512.0) and Public Finance Section. |
 Print Page
 Print Page