STATE FINAL DEMAND
SEPTEMBER KEY FIGURES(a), Western Australia |
|
 |  | Jun qtr 2010 to Sep qtr 2010 | Sep qtr 2009 to Sep qtr 2010 |
 |  | % change | % change |
Trend |
|
| Final consumption expenditure |  |  |
 | General government | 0.5 | 2.1 |
 | Households | 1.1 | 5.0 |
| Gross fixed capital formation |  |  |
 | Private | 1.9 | 5.5 |
 | Public | -1.5 | 26.8 |
| State final demand | 1.2 | 5.9 |
Seasonally Adjusted |
|
| Final consumption expenditure |  |  |
 | General government | 0.3 | 2.1 |
 | Households | 0.1 | 4.7 |
| Gross fixed capital formation |  |  |
 | Private | 0.6 | 7.3 |
 | Public | 2.0 | 30.9 |
| State final demand | 0.4 | 6.5 |
|
(a) Chain volume measures
Source: Australian National Accounts: National Income, Expenditure and Product, (cat. no. 5206.0). |
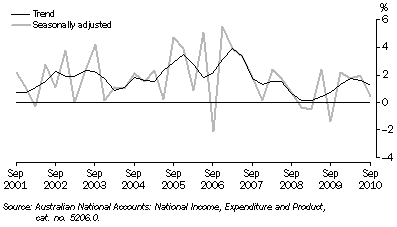
- In the September quarter 2010, state final demand in WA (chain volume measures) increased by 1.2% in trend and 0.4% in seasonally adjusted terms. This growth was slower than in the previous three quarters, but equates to an increase of around 6% in both series since the September quarter 2009, the strongest annual growth of all states and territories.
- Final consumption expenditure by households, which makes up about 44% of total state final demand, recorded an annual increase of around 5% in both trend and seasonally adjusted terms. Private gross fixed capital formation, contributing over a third (37%) to state final demand, also recorded steady annual growth (about 6% in trend and 7% in seasonally adjusted terms).
State Final Demand, Chain volume measures - Change from previous quarter

- The quarterly State Final Demand value has not decreased in trend terms in almost 10 years, a record unmatched by any other state or territory. After flattening in late 2008 and early 2009, growth in state final demand began to strengthen again, although a smaller increase (1.2%) in the September quarter 2010 suggests a slowing of this trend.
This link takes you to the Downloads page of
Australian National Accounts: National Income, Expenditure, and Product, Sep 2010 (cat. no. 5206.0). Table 21 provides State Final Demand, Summary Components by State. Table 26 provides State Final Demand, Detailed Components for Western Australia.
 Print Page
 Print All