SURVEY OF INVOLVEMENT IN ORGANISED SPORT AND PHYSICAL ACTIVITY
The Survey of Involvement in Organised Sport and Physical Activity collects information on paid and unpaid involvement in sport and whether this was in a playing or non-playing role such as coach, umpire or administrator.
The 2007 survey found that there were 1.6 million persons (9.9% of persons aged 15 years and over) involved in at least one non-playing role in organised sport and physical activity during the 12 months ended April 2007. Over a third (40%) of these people were involved in more than one non-playing role.
There were 658,500 persons involved as a coach, instructor or teacher; 682,600 as a committee member or administrator; and 381,200 as a referee or umpire. Males had a higher involvement rate than females in each of these roles - 4.8% compared with 3.3% for coach, instructor or teacher; 4.4% compared with 4.0% for committee member or administrator; and 2.9% compared with 1.8% for referee or umpire.
Of the 1.6 million persons involved in non-playing roles, 56% (904,400) were associated with school or junior sport and 38% (609,700) had completed a course or qualification relevant to their role.
8.7 Persons involved in organised sport and physical activity, By role and sex - 2007 |
|
 |  | MALES | FEMALES | PERSONS |
 |  | Total involvements | Participation rate(a) | Total involvements | Participation rate(a) | Total involvements | Participation rate(a) |
 |  | '000 | % | '000 | % | '000 | % |
|
| Playing | 2 129.6 | 26.5 | 1 685.5 | 20.4 | 3 815.0 | 23.4 |
| Non-playing involvement |  |  |  |  |  |  |
 | Coach, instructor, teacher | 385.6 | 4.8 | 272.9 | 3.3 | 658.5 | 4.0 |
 | Referee or umpire | 232.7 | 2.9 | 148.5 | 1.8 | 381.2 | 2.3 |
 | Committee member or administrator | 355.4 | 4.4 | 327.2 | 4.0 | 682.6 | 4.2 |
 | Scorer or timekeeper | 301.1 | 3.7 | 314.8 | 3.8 | 615.8 | 3.8 |
 | Medical support | 83.2 | 1.0 | 95.1 | 1.2 | 178.2 | 1.1 |
 | Other involvement | 49.7 | 0.6 | 45.9 | 0.6 | 95.6 | 0.6 |
 | Total persons with non-playing involvement(b) | 883.5 | 11.0 | 737.8 | 8.9 | 1 621.4 | 9.9 |
| Total persons involved(c) | 2 449.2 | 30.4 | 2 006.2 | 24.3 | 4 455.4 | 27.3 |
|
| (a) Total number of persons involved in organised sport and physical activity, expressed as a percentage of the population in the same group. |
| (b) Components do not add to total as some persons were involved in more than one non-playing role. |
| (c) Components do not add to total as some persons were involved in both playing and non-playing roles. |
| Source: Involvement in Organised Sport and Physical Activity, Australia, Apr 2007 (cat. no. 6285.0) |
Of the 1.6 million people involved in a non-playing role, 16% (265,900) received some payment. By comparison, 3.0% (114,700) received some payment for their playing role.
Coaches, instructors or teachers were more likely to receive some payment (22%, 145,100) followed closely by referees or umpires (21%, 81,800), with persons providing medical support least likely to receive some payment (10%, 18,400). Of these almost 90% of referees or umpires and just over 50% of coaches, instructors or teachers received less than $5,000 per year. Just 13% of players (15,100) received more than $5,000 per year.
8.8 Persons involved in organised sport and physical activity, By role and payment status - 2007 |
|
 |  | Some paid involvements | Unpaid involvements only(a) | Total involvements |
 |  | '000 | '000 | '000 |
|
| Playing | 114.7 | 3 700.3 | 3 815.0 |
| Non-playing involvement |  |  |  |
 | Coach, instructor, teacher | 145.1 | 513.4 | 658.5 |
 | Referee or umpire | 81.8 | 299.4 | 381.2 |
 | Committee member or administrator | 41.0 | 641.6 | 682.6 |
 | Scorer or timekeeper | 26.6 | 589.2 | 615.8 |
 | Medical support and other involvement | 34.3 | 231.6 | 265.9 |
| Total persons with non-playing involvement(b) | 265.9 | 1 355.5 | 1 621.4 |
| Total persons involved(c) | 348.7 | 4 306.9 | 4 455.4 |
|
| (a) Includes those who did not know whether they would be paid for their involvement. |
| (b) Components do not add to total as some persons were involved in more than one non-playing role. |
| (c) Components do not add to total as some persons were involved in both playing and non-playing roles. |
| Source: Involvement in Organised Sport and Physical Activity, Australia, April 2007, (cat.no. 6285.0). |
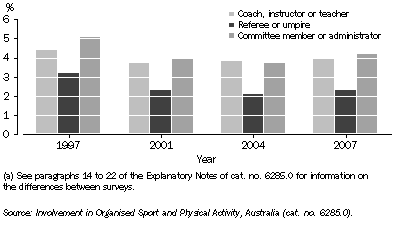
A comparison of involvement rates over time can be made for the three non-playing role categories of coach, instructor or teacher; referee or umpire; and committee member or administrator. There was a decline in the rate of involvement in all roles from 1997 to 2001 (coaches from 4.4% to 3.7%, referees or umpires from 3.2% to 2.3% and committee members from 5.1 to 4.0%). However, there have been no major decreases in these rates in subsequent surveys.
8.9 Participation in selected non-playing roles, By survey year (a)

 Print Page
 Print All