 SOCIAL SERVICES
Sources of Income
Expenses
SUMMARY OF OPERATIONS
At the end of June 2007, there were 5,769 not-for-profit social services organisations in Australia. Examples of these types of organisations include youth and family welfare services, childcare, services for the disabled and elderly (excluding high care residential services), refugee and homeless assistance, emergency accommodation and shelters.
These organisations employed 221,549 people at the end of June 2007 and were characterised by a large part-time and casual workforce. Permanent part-time employees accounted for over a third (39.7% or 87,910 people) of total employment, casual employees 28.8% (63,885 people) and permanent full-time employees 31.5% (69,754 people).
In addition to paid employees, there were 255,305 volunteers during the 2006-07 financial year.
Industry value added by these organisations was $6.7b.
SOURCES OF INCOME
During the 2006-07 financial year, not-for-profit social services organisations received $11.7b in income.
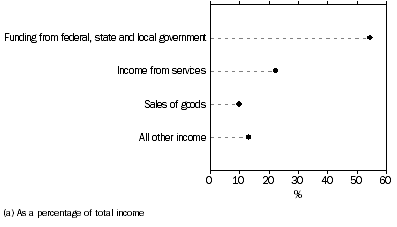
The graph below shows that the main source of income for these organisations was funding from federal, state and local government, which accounted for over half (54.6% or $6.4b) of total income. More than two thirds of this funding was volume based (69.2% or $4.4b), with a further third (29.5% or $1.9b) of the funding being allocated on a non-volume basis.
SOURCES OF INCOME, Social services(a)

Income from services accounted for 22.3% ($2.6b) of total income, and sales of goods 10% ($1.2b).
EXPENSES
During the 2006-07 financial year, not-for-profit social services organisations incurred $10.4b in expenses.
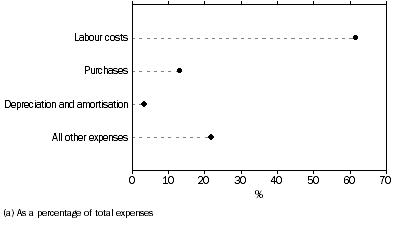
The graph below shows that the main expense item for these organisations was labour costs, which accounted for 61.6% ($6.4b) of total expenses.
EXPENSE ITEMS, Social services(a)

Purchases accounted for 13.1% ($1.4b) of total expenses, and depreciation and amortisation accounted for 3.5% ($0.4b).
 Print Page
 Print All
 Quality Declaration