 OVERVIEW
Sources of Income
Expenses
SUMMARY OF OPERATIONS
At the end of June 2007, there were 41,008 not-for-profit organisations in Australia. Religious organisations accounted for 21.4% (8,786) of all not-for-profit organisations, followed by Culture and recreation organisations which accounted for 20.1% (8,258).
Not-for-profit organisations employed 889,919 people at the end of June 2007. Social services organisations accounted for 24.9% (221,549 people) of total employees, followed by Education and research organisations (24.5% or 218,388 people). Permanent full-time employees accounted for 41.4% (368,514 people) of total employment in the not-for-profit sector and permanent part-time and casual employees 34.3% (305,332 people) and 24.3% (216,074 people) respectively.
In addition to paid employees, there were 2,182,476 volunteers during 2006-07.
Industry value added by these organisations was $35.9b for the 2006-07 financial year and capital expenditure was $8.8b for the same period.
SOURCES OF INCOME
During the 2006-07 financial year, not-for-profit organisations received $76b in income.
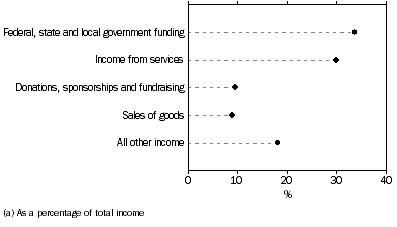
The main source of income for these organisations was funding from federal, state and local government, which accounted for just over a third (33.5% or $25.5b) of total income. This funding was primarily received by Education and research (32.1% or $8.2b) and Social services (25.2% or $6.4b) organisations. Over two-thirds (69.2% or $17.6b) of total government funding to not-for-profit organisations was volume based funding (for example, granted on a per student or a per client basis).
SOURCES OF INCOME, Not-for-profit organisations, Australia(a)

Income from services accounted for 29.9% ($22.7b) of total income. The majority of this income was earned by Culture and recreation organisations (28.3% or $6.4b) and Education and research (23.8% or $5.4b). Donations, sponsorship and fundraising accounted for 9.5% ($7.2b) of total income and sales of goods 8.9% ($6.8b).
EXPENSES
During the 2006-07 financial year, not-for-profit organisations incurred $70b in expenses.
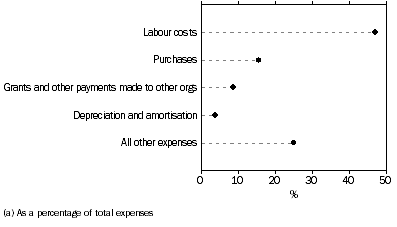
The graph below shows that the main expense incurred by these organisations was labour costs, which accounted for nearly half of total expenses (46.8% or $32.8b). Education and research organisations accounted for 29% ($9.5b) of total labour costs and Social services organisations 19.5% ($6.4b).
EXPENSE ITEMS, Not-for-profit organisations, Australia(a)

Purchases accounted for 15.6% of total expenses ($10.9b), grants and other payments made to other organisations, businesses and individuals 8.5% ($6b) and depreciation and amortisation 3.9% ($2.7b).
 Print Page
 Print All
 Quality Declaration