Immigration and the states and territories
All three components of population change: natural increase, NOM and NIM, contribute in varying degrees to the growth, size and structure of the population of each state and territory. While natural increase generally has a positive effect, NOM and NIM can have a strong impact by either adding to the population or causing the population to decline.
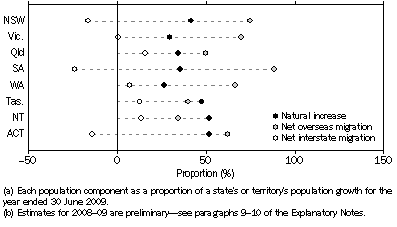
All states and territories experienced positive population growth in the year ended 30 June 2009. New South Wales experienced the largest growth numerically at 119,500 persons (1.7%). However, Western Australia had the highest rate of growth at 3.1% with 68,100 persons (Table 2.2). The proportion that each component contributed to population growth varied between the states and territories. Natural increase was the major contributor to population growth in Tasmania and the Northern Territory for the year ended 30 June 2009 (Figure 2.3). For the Australian Capital Territory and the other states, NOM contributed the most to population growth.
2.2 Components of Population Change(a), Australia - Numbers and growth rates - 2008-09 |
|
 |  | NSW | Vic. | Qld | SA | WA | Tas. | NT | ACT | Aust. |
|
| Number ('000) |  |  |  |  |  |  |  |  |  |
 | ERP 30 June 2008 | 7 014.9 | 5 327.0 | 4 308.6 | 1 604.0 | 2 177.0 | 497.9 | 220.5 | 346.3 | 21 498.5 |
 | Natural increase | 49.9 | 34.3 | 40.1 | 7.0 | 18.1 | 2.6 | 2.8 | 3.1 | 157.8 |
 | Net overseas migration | 89.5 | 81.2 | 58.0 | 17.3 | 45.2 | 2.1 | 1.9 | 3.7 | 298.9 |
 | Net interstate migration | -19.8 | 0.7 | 18.4 | -4.7 | 4.8 | 0.7 | 0.7 | -0.8 | . . |
 | Growth | 119.5 | 116.3 | 116.5 | 19.6 | 68.1 | 5.4 | 5.4 | 5.9 | 456.7 |
 | ERP 30 June 2009 | 7 134.4 | 5 443.2 | 4 425.1 | 1 623.6 | 2 245.1 | 503.3 | 225.9 | 352.2 | 21 955.3 |
| Growth rate (%) |  |  |  |  |  |  |  |  |  |
 | Natural increase | 0.71 | 0.64 | 0.93 | 0.43 | 0.83 | 0.51 | 1.28 | 0.88 | 0.73 |
 | Net overseas migration | 1.28 | 1.52 | 1.35 | 1.08 | 2.08 | 0.43 | 0.85 | 1.06 | 1.39 |
 | Net interstate migration | -0.28 | 0.01 | 0.43 | -0.29 | 0.22 | 0.13 | 0.34 | -0.24 | . . |
 | Growth | 1.70 | 2.18 | 2.70 | 1.22 | 3.13 | 1.08 | 2.46 | 1.70 | 2.12 |
|
| . . not applicable |
| (a) Estimates for 2008-09 are preliminary - see paragraphs 9-10 of the Explanatory Notes. |
Net overseas migration
For the year ended 30 June 2009, all states and territories experienced positive NOM (Figure 2.3). Net overseas migration was the major component of population growth in South Australia at 88% (17,300 persons), New South Wales at 75% (89,500 persons), Victoria at 70% (81,200 persons), Western Australia at 66% (45,200 persons), the Australian Capital Territory at 62% (3,700 persons) and Queensland at 50% (58,000 persons). Tasmania and the Northern Territory also gained population through NOM but it was not the major component of their population growth. Net overseas migration accounted for 40% (2,100 persons) of Tasmania's population growth in 2008-09, and 34% (1,900 persons) of the Northern Territory's growth.
As shown in table 2.2, Western Australia had the highest net overseas migration growth rate (2.1%) while Tasmania (0.4%) had the lowest.
2.3 Population Components, Proportion of total growth(a)
- Year ended 30 June 2009(b)

Net interstate migration
Preliminary NIM was not the major component of population growth for any of the states and territories for the year ended 30 June 2009 (Figure 2.3). However, it was a major source of population loss for South Australia, New South Wales and the Australian Capital Territory, subtracting 24% (4,700 persons), 17% (19,800 persons) and 14% (820 persons) respectively from their total population growth. Those states and territories where NIM contributed positively to population growth were Queensland at 16% (18,400 persons), the Northern Territory at 14% (750 persons), Tasmania at 13% (670 persons), Western Australia at 7% (4,800 persons) and Victoria at less than 1% (700 persons). Overall, estimates of interstate migration for Australia showed there were 359,900 interstate movements for the year ended 30 June 2009.
 Print Page
 Print All