|
|
CONSUMER PRICE INDEX
CONSUMER PRICE INDEX(a), Perth |
|
 | Jun qtr 2010 to Sep qtr 2010 | Sep qtr 2009 to Sep qtr 2010 |
 | % change | % change |
|
| All groups | 0.5 | 3.1 |
| Food | -0.5 | 1.3 |
| Alcohol and tobacco | 2.9 | 11.4 |
| Clothing and footwear | 0.1 | -0.9 |
| Housing | 2.0 | 5.9 |
| Household contents and services | -0.1 | 0.4 |
| Health | -0.8 | 4.2 |
| Transportation | -0.8 | 0.8 |
| Communication | -0.1 | -0.3 |
| Recreation | 0.0 | -0.3 |
| Education | 0.0 | 7.8 |
| Financial and insurance services(b) | 0.0 | 2.7 |
|
| (a) Unless otherwise specified, base of each index: 1989-90 = 100.0. |
| (b) Base of index: June quarter 2005 = 100.0. |
Source: Consumer Price Index, Australia (cat. no. 6401.0).
|
- Perth's Consumer Price Index (CPI) increased 0.5% in the September quarter 2010, the lowest increase among the eight capital cities.
- Most groups recorded only modest change in the September quarter 2010, with the largest increase for Alcohol and tobacco (2.9%) and the largest decreases for Health and Transportation (both -0.8%).
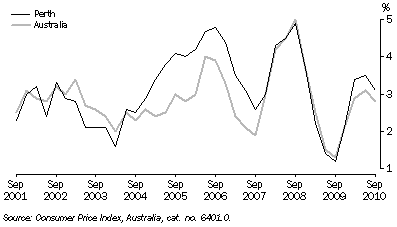
Consumer Price Index (All Groups), Annual change

- In the year to September 2010, Perth recorded the equal highest annual CPI increase, along with Melbourne (both 3.1%), of the Australian capital cities. Others recorded annual increases of between 2% and 3%.
- Driven by escalating housing costs and strong growth in the resources and construction industries between 2005 and 2007, Perth recorded much higher annual CPI increases during those years than occurred in the CPI weighted national average.
- Following the boom period, annual changes in the Perth CPI were similar to the national average. However, in 2010, there has been a return to higher annual CPI changes for Perth than across Australia.
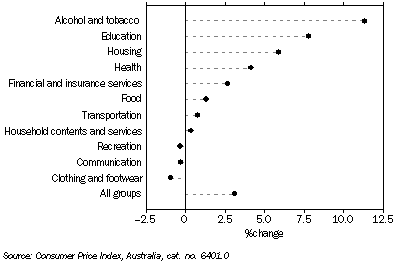
Consumer Price Index, by Group - Change from September qtr 2009 to September qtr 2010

- Over the year to September 2010, the main contributors to Perth's CPI increase were Alcohol and tobacco (11%); Education (8%); and Housing (6%). Clothing and footwear, Communication and Recreation were the only groups to record small decreases over the same period.
CONSUMER PRICE INDEX, Selected Annual Increases and Decreases, September qtr 2009 to September qtr 2010 |
|
Increases |  | Decreases |
|  |
|
| Sub-group/Expenditure Class | % change |  | Sub-group/Expenditure Class | % change |
|
| Tobacco | 26.6 |  | Audio, visual & computing equip | -18.3 |
| Utilities | 19.3 |  | Women's footwear | -12.4 |
| Men's footwear | 12.5 |  | Towels and linen | -10.6 |
| Secondary education | 10.0 |  | Children's and infants' clothing | -6.7 |
| Pork | 7.1 |  | Major household appliances | -6.3 |
|
Source: Consumer Price Index, Australia (cat. no. 6401.0).
- The annual increase in the consumer price index for Alcohol and Tobacco was driven by the recent government tax on Tobacco, with prices for this sub-group soaring by almost 27% in the last 12 months. Similarly, recent increases in Utilities prices (including electricity, water and gas), were the key drivers of the increase in the price index for Housing.
- The sub-groups to record the largest decreases in the 12 months to September 2010 were for popular retail products, including electronic equipment and household appliances. This reflects the rising Australian dollar reducing the cost of imports and discounting in some areas of the retail industry in order to stimulate consumer activity.
This link takes you to the Downloads page of Consumer Price Index, Australia, Sep 2010 (cat. no. 6401.0).
|
|
 Print Page
 Print All