NEW MOTOR VEHICLE SALES
NOVEMBER KEY FIGURES, Western Australia |
|
 | Nov 2010 | Oct 2010 to Nov 2010 | Nov 2009 to Nov 2010 |
 | no. | % change | % change |
Trend |
|
| Passenger Vehicles | 4 897 | -0.8 | 11.5 |
| Sports Utility Vehicles | 2 558 | 1.6 | 25.0 |
| Other Vehicles | 2 211 | -0.8 | 5.9 |
| Total Vehicle Sales | 9 666 | -0.2 | 13.4 |
Seasonally Adjusted |
|
| Passenger Vehicles | 5 016 | 8.7 | 21.6 |
| Sports Utility Vehicles | 2 569 | 1.7 | 19.8 |
| Other Vehicles | 2 182 | -0.5 | 12.2 |
| Total Vehicle Sales | 9 767 | 4.6 | 11.5 |
|
| Source: Sales of New Motor Vehicles, Australia (cat. no. 9314.0). |
- In November 2010, sales of new motor vehicles in WA decreased marginally in trend terms. The more volatile seasonally adjusted series showed a monthly increase of 4.6% following a 5.3% decrease in the previous month.
- Compared with November of the previous year, November 2010 saw sales for vehicles rise more than 13% in trend terms and more than 11% in seasonally adjusted terms.
- All motor vehicle categories recorded significantly more sales in November 2010 than in November 2009. The largest proportional increase in trend terms was for sales of Sports Utility Vehicles, up 25% over the year.
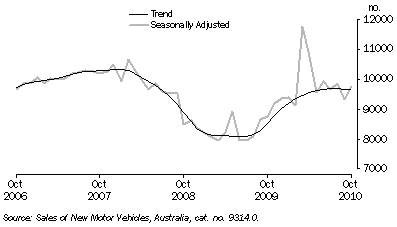
New Motor Vehicle Sales, Total Vehicles

- After peaking at 10,300 (trend) in February 2008, new vehicle sales generally declined for the following 18 months as the global financial crisis took effect, falling below 8,100 in mid-2009. At that time, monthly sales started to rise again but are yet to reach previous peak levels.
- The notable spike in the seasonally adjusted estimate for vehicle sales in April 2010 (to 11,800, an increase of 29% from the previous month) reflected the large number of heavily discounted, hail-damaged cars sold by dealerships after a heavy storm hit the Perth metropolitan area in March.
The following links take you to time series spreadsheets from
Sales of New Motor Vehicles, Australia, November 2010 (cat. no. 9314.0). Table 2 contains data by state.
 Print Page
 Print All