 CHILDREN'S ACTIVITIES OVER TIME
CHANGES IN PARTICIPATION SINCE 2003
Surveys of children's participation in culture and leisure activities have been conducted previously by the ABS in 2000, 2003 and 2006. A comparison of the data from 2003 to 2009 shows that the participation rate in organised sport did not increase significantly (62% in 2003 to 63% in 2009). There was an increase in the participation rate for organised cultural activities (30% in 2003 to 34% in 2009). Participation rates for males in at least one organised sport did not change significantly over the six year period. After showing an increase of three percentage points from 54% in 2003 to 57% in 2006, female participation rates in at least one organised sport did not show any significant change in 2009 (56%). (Table 1)
After a three percentage point increase from 2003 to 2006, participation rates in at least one organised cultural activity did not change significantly in the period to 2009 (33% to 34%). Playing a musical instrument remained the most popular selected cultural activity for boys (19%) while dancing remained the most popular cultural activity for girls (26%). (Table 1)
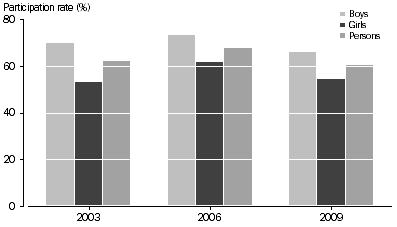
There was a decrease in the bike riding participation rate, falling from 68% in 2006 to 60% in 2009. This was evident in the participation rate for both sexes. The participation rate for all the other selected activities showed little change. In 2009, two new categories were introduced: 'Skateboarding, rollerblading or riding a scooter' and 'Other screen-based activities'. (Table 1)
CHILDREN'S PARTICIPATION IN BIKE RIDING, By sex
- 2003 to 2009

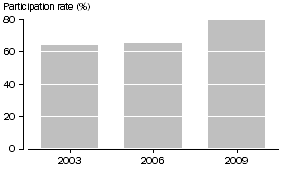
The proportion of children accessing the Internet did not change noticeably between 2003 and 2006 (64% in 2003 to 65% in 2006) but increased significantly to 79% for 2009. The proportion of children using a computer for any purpose was recorded in previous surveys but was not recorded in 2009. Instead, new information about children's mobile phone ownership was collected. (Table 1)
CHILDREN'S USE OF THE INTERNET, 2003 to 2009

 Print Page
 Print All
 Quality Declaration