 WORK
WORK
INDUSTRY AND OCCUPATION OF EMPLOYMENT
According to the 2006 Census:
- One in four self-employed Indigenous people worked in the Construction industry (26%) and around one in ten worked in the Transport, Postal and Warehousing industries (9%).
- By comparison, one in five self-employed non-Indigenous people worked in the Construction industry (20%) and around one in ten worked in the Professional, Scientific and Technical Services industries (11%).
Selected employment types by industry of employment(a)(b) |
|
 | Indigenous | Non-Indigenous |
 | Self-employed | Employees | Self-employed | Employees |
| Industry | % | % | % | % |
|
| Agriculture, Forestry and Fishing | 6.3 | 2.8 | 7.4 | 1.5 |
| Mining | 0.8 | 2.3 | 0.3 | 1.4 |
| Manufacturing | 6.6 | 8.0 | 7.8 | 11.5 |
| Electricity, Gas, Water and Waste Services | 0.8 | 1.0 | 0.4 | 1.2 |
| Construction | 25.7 | 6.2 | 19.9 | 5.7 |
| Wholesale Trade | 3.1 | 2.6 | 4.2 | 4.6 |
| Retail Trade | 7.4 | 8.1 | 9.8 | 12.1 |
| Accommodation and Food Services | 4.1 | 6.8 | 4.9 | 6.8 |
| Transport, Postal and Warehousing | 8.6 | 3.9 | 6.0 | 4.6 |
| Information Media and Telecommunications | 1.4 | 1.1 | 1.3 | 2.2 |
| Financial and Insurance Services | 1.4 | 1.2 | 2.7 | 4.3 |
| Rental, Hiring and Real Estate Services | 1.3 | 1.0 | 2.2 | 1.6 |
| Professional, Scientific and Technical Services | 6.1 | 2.2 | 11.0 | 6.1 |
| Administrative and Support Services | 5.7 | 3.8 | 4.7 | 2.9 |
| Public Administration and Safety | 1.4 | 19.1 | 0.6 | 8.1 |
| Education and Training | 3.3 | 9.2 | 2.4 | 9.1 |
| Health Care and Social Assistance | 6.5 | 15.9 | 6.0 | 11.8 |
| Arts and Recreation Services | 3.0 | 1.6 | 1.6 | 1.4 |
| Other Services | 6.4 | 3.3 | 6.9 | 3.2 |
| Total | 100.0 | 100.0 | 100.0 | 100.0 |
|
| (a) Aged 15-64 years. |
| (b) Excludes persons for whom industry was inadequately described. |
| Source: 2006 Census of Population and Housing |
REMOTENESS AREAS
According to the 2006 Census:
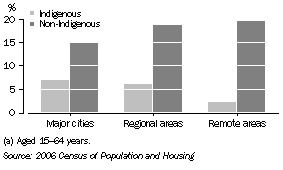
- For non-Indigenous people, self-employment rates were lower in major cities (15%) than in regional and remote areas (both 19%).
- By contrast, self-employment rates for Indigenous people were lower in remote areas (2%) than in regional areas (6%) and major cities (7%).
- Among self-employed people in remote areas, only 15% of Indigenous people worked in the Agriculture, Forestry and Fishing industries (e.g. farming) compared with 44% of non-Indigenous people.
Self-employed persons(a) by remoteness

OCCUPATION
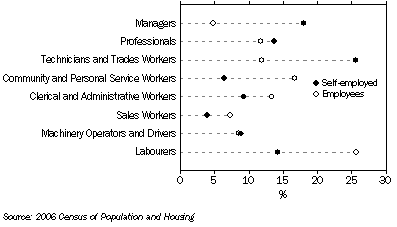
- One in four self-employed Indigenous people (26%) were working in the Technicians and Trades Workers group of occupations.
- A much higher proportion of self-employed Indigenous people than employees were managers (18% compared with 5%).
Selected employment types by occupation, Indigenous persons aged 15-64 years

FULL-TIME AND PART-TIME WORK
In 2006:
- A higher proportion of Indigenous self-employed people than employees were engaged in full-time work (i.e. 35 hours or more per week) (68% compared with 59%).
- Indigenous males who were self-employed were more likely than Indigenous male employees to work full-time (76% compared with 68%).
- For both groups of employed Indigenous females, around half worked full-time and half part-time.
- The average number of hours per week worked by self-employed Indigenous people was 41 hours and for employees, was 34 hours. The patterns were similar for non-Indigenous people with an average of 42 hours for those self-employed, compared with 36 hours for employees.
- One in three self-employed Indigenous people (34%) and one in ten employees (11%) worked 49 hours or more per week.
Work patterns by employment type, Indigenous status and sex(a)(b) |
|
 |  | Self-employed | Employees |
 |  | Full-time | Part-time | Full-time | Part-time |
|
| Indigenous |  |  |  |  |
 | Males (%) | 76.4 | 23.6 | 67.9 | 32.1 |
 | Females (%) | 51.1 | 48.9 | 48.9 | 51.1 |
 | Persons (%) | 68.4 | 31.6 | 58.8 | 41.2 |
 | Total (no.) | 4 134 | 1 915 | 59 571 | 41 750 |
| Non-Indigenous |  |  |  |  |
 | Males (%) | 82.2 | 17.8 | 83.2 | 16.8 |
 | Females (%) | 50.6 | 49.4 | 53.8 | 46.2 |
 | Persons (%) | 72.2 | 27.8 | 68.8 | 31.2 |
 | Total (no.) | 948 387 | 365 470 | 4 587 481 | 2 079 653 |
|
| (a) Persons aged 15-64 years. |
| (b) Excludes persons who were employed and away from work. |
| Source: 2006 Census of Population and Housing |
 Print Page
 Print All