 PEOPLE AGED 45–64 YEARS
PEOPLE AGED 45-64 YEARS
By the time a person reaches their mid-forties, it would generally be expected that they had some work experience behind them, had possibly established a career and advanced to more senior levels in workplaces, perhaps had a growing family and, in later years, be considering the prospect of retirement. Many people continue to learn through non formal studies and, in some instances, return to formal study during these years8.
Formal learning
Of all people with specific limitations and restrictions aged 45-64yrs who had participated in learning in the last 12 months, 8% had participated in formal learning compared, to 10% of those with no disability.
Non-formal learning
In this age range, a smaller proportion of people with specific restrictions had participated in non-formal courses in the last 12 months (24%) compared to people with no disability (33%).
People with specific restrictions also had lower participation rates in non-formal learning for work related reasons (56%) than those with no disability (70%).
Barriers to participation
With the changing demographic in Australia, people are generally being encouraged to stay at work for longer with access to the age pension being raised year by year9. In order to be competitive in an increasingly competitive job market, people are actively encouraged at all ages to continue to learn. It is therefore of interest to understand the barriers that might prevent a person from being able to participate in learning.
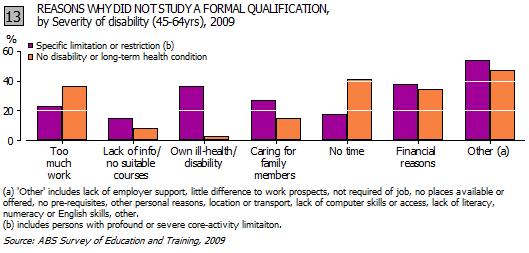
People with specific restrictions who would like to have studied for formal qualifications in the last 12 months, but did not, stated that financial reasons (38%), their own ill health (36%) or caring for family members (27%) prevented them from being able to do so (Graph 13).

People with specific restrictions who wanted to, but did not, participate in more non-formal learning in the last 12 months, reported that their own ill health (31%), no time (24%) and too much work (21%) were key reasons preventing from being able to do so (Graph 14).
In addition, more people with specific restrictions in this age group, reported that they lacked information or that there were no suitable courses available (14%), compared to people with no disability (8%). These people were also more than twice as likely to report that they had no places available compared to people without disability (9% and 4% respectively).
Labour force
Of all people with specific restrictions in this age group, 42% were employed compared to 82% of those with no disability (Graph 15). More people were in employment between the ages of 45-54yrs than in later years.
People in this age group who were employed were more likely to have qualifications in vocational education than in University degrees (Graph 16).
Those with specific restrictions generally had higher rates of VET attainment (65%) than people with no disability (57%) and lower rates of University qualifications (32%) compared to those with no disability (41%).
 Print Page
 Print All