 THE WORKFORCE
3.1 Introduction
3.2 Employment
3.3 Retirement
Have your say
3.1 INTRODUCTION
Population ageing is expected to have a significant impact on work for a range of reasons including:
- The proportion of the population who are of traditional working age will decrease, therefore presenting challenges in terms of labour supply to meet demand;
- At the same time the overall population will continue to grow, therefore resulting in increasing demand for goods and services; and
- The increase in the proportion of the population who are older is expected to result in a change in the nature of the goods and services required. For example, it is expected that there will be an increase in demand for health and community care services and therefore for workers in these areas.
To inform workforce planning this Chapter presents information on a range of indicators, including employment status, focusing on mature age workers (that is, people aged 45 years and over) highlighting participation rates and underutilisation.
It also outlines the industries where mature age workers currently work.
Finally, it provides information on retirement, including current average age of retirement and retirement intentions.
3.2 EMPLOYMENT
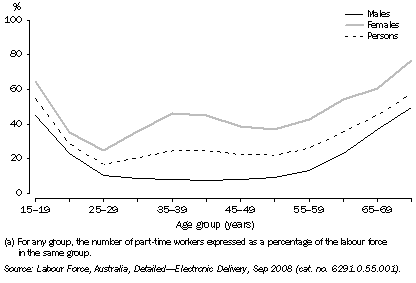
In 2007-08, persons aged 45 years and over accounted for 37% of the NSW labour force, of which 71% were employed full-time, 26% were employed part-time and nearly 3% were unemployed. For males, the 30-34 years age group recorded a high participation rate of 94% while for females the 45-49 years age group recorded a high participation rate of 78%. Females recorded a higher part-time rate than males at all ages. The 70 years and over age group recorded high part-time rates for both males (49%) and females (77%).
3.1 PART-TIME EMPLOYMENT RATES(a), By selected ages and sex, NSW
- 2007-08

3.2 EMPLOYMENT STATUS, By age, NSW - 2007-08 |
|
 | Employed |  |  |  |  |  |  |
 | Full-time | Part-time | Total | Unemployed | Labour force | Civilian population(a) | Unemployment rate | Part-time employment rate(b) | Participation rate(c) |
| Age group (years) | '000 | '000 | '000 | '000 | '000 | '000 | % | % | % |
Males |
|
| 15-19 | 50.8 | 58.2 | 109.0 | 20.9 | 129.9 | 239.0 | 16.1 | 44.9 | 54.4 |
| 20-24 | 142.7 | 46.0 | 188.7 | 13.2 | 201.9 | 239.2 | 6.5 | 22.8 | 84.4 |
| 25-29 | 186.8 | 22.8 | 209.7 | 9.8 | 219.4 | 239.9 | 4.5 | 10.4 | 91.5 |
| 30-34 | 198.6 | 19.7 | 218.3 | 6.8 | 225.1 | 239.9 | 3.0 | 8.8 | 93.8 |
| 35-39 | 207.8 | 18.2 | 226.0 | 6.6 | 232.6 | 251.8 | 2.8 | 7.8 | 92.4 |
| 40-44 | 195.3 | 16.4 | 211.7 | 6.1 | 217.8 | 242.6 | 2.8 | 7.5 | 89.8 |
| 45-49 | 203.8 | 18.1 | 222.0 | 5.8 | 227.8 | 250.2 | 2.5 | 8.0 | 91.0 |
| 50-54 | 170.8 | 17.6 | 188.5 | 6.5 | 195.0 | 224.8 | 3.4 | 9.0 | 86.7 |
| 55-59 | 131.3 | 20.4 | 151.7 | 5.2 | 156.9 | 209.8 | 3.3 | 13.0 | 74.8 |
| 60-64 | 70.9 | 21.8 | 92.7 | 3.5 | 96.1 | 183.0 | 3.6 | 22.6 | 52.5 |
| 65-69 | 23.4 | 14.2 | 37.5 | 0.6 | 38.1 | 137.8 | 1.6 | 37.1 | 27.7 |
| 70 and over | 10.8 | 10.6 | 21.4 | 0.1 | 21.5 | 305.3 | 0.5 | 49.2 | 7.0 |
Females |
|
| 15-19 | 26.0 | 82.2 | 108.2 | 19.0 | 127.1 | 227.6 | 14.9 | 64.7 | 55.8 |
| 20-24 | 104.6 | 61.9 | 166.5 | 11.1 | 177.6 | 232.4 | 6.2 | 34.9 | 76.4 |
| 25-29 | 126.7 | 43.5 | 170.2 | 8.0 | 178.2 | 235.7 | 4.5 | 24.4 | 75.6 |
| 30-34 | 105.1 | 62.3 | 167.4 | 7.1 | 174.5 | 242.2 | 4.1 | 35.7 | 72.1 |
| 35-39 | 88.5 | 82.9 | 171.3 | 8.5 | 179.8 | 255.3 | 4.7 | 46.1 | 70.4 |
| 40-44 | 93.3 | 82.4 | 175.7 | 8.9 | 184.7 | 243.4 | 4.8 | 44.7 | 75.9 |
| 45-49 | 113.8 | 76.6 | 190.4 | 6.7 | 197.1 | 251.3 | 3.4 | 38.9 | 78.4 |
| 50-54 | 100.5 | 62.0 | 162.5 | 4.6 | 167.1 | 227.7 | 2.7 | 37.1 | 73.4 |
| 55-59 | 66.9 | 51.4 | 118.3 | 2.4 | 120.6 | 211.4 | 2.0 | 42.5 | 57.1 |
| 60-64 | 28.1 | 35.4 | 63.5 | 2.0 | 65.5 | 181.5 | 3.1 | 54.1 | 36.1 |
| 65-69 | 7.6 | 11.8 | 19.3 | 0.1 | 19.5 | 139.8 | 0.6 | 60.4 | 13.9 |
| 70 and over | 2.0 | 6.7 | 8.7 | - | 8.7 | 396.9 | - | 76.9 | 2.2 |
Persons |
|
| 15-19 | 76.7 | 140.4 | 217.1 | 39.9 | 257.0 | 466.6 | 15.5 | 54.7 | 55.1 |
| 20-24 | 247.3 | 108.0 | 355.2 | 24.3 | 379.5 | 471.6 | 6.4 | 28.5 | 80.5 |
| 25-29 | 313.5 | 66.4 | 379.9 | 17.8 | 397.7 | 475.6 | 4.5 | 16.7 | 83.6 |
| 30-34 | 303.6 | 82.1 | 385.7 | 13.9 | 399.6 | 482.1 | 3.5 | 20.5 | 82.9 |
| 35-39 | 296.3 | 101.1 | 397.4 | 15.1 | 412.4 | 507.2 | 3.7 | 24.5 | 81.3 |
| 40-44 | 288.6 | 98.9 | 387.5 | 15.0 | 402.5 | 485.9 | 3.7 | 24.6 | 82.8 |
| 45-49 | 317.7 | 94.7 | 412.4 | 12.5 | 424.8 | 501.5 | 2.9 | 22.3 | 84.7 |
| 50-54 | 271.3 | 79.7 | 351.0 | 11.1 | 362.1 | 452.5 | 3.1 | 22.0 | 80.0 |
| 55-59 | 198.2 | 71.8 | 270.0 | 7.6 | 277.6 | 421.2 | 2.7 | 25.9 | 65.9 |
| 60-64 | 98.9 | 57.2 | 156.1 | 5.5 | 161.6 | 364.5 | 3.4 | 35.4 | 44.3 |
| 65-69 | 30.9 | 26.0 | 56.9 | 0.7 | 57.6 | 277.5 | 1.2 | 45.1 | 20.8 |
| 70 and over | 12.8 | 17.3 | 30.1 | 0.1 | 30.2 | 702.2 | 0.3 | 57.3 | 4.3 |
|
| - nil or rounded to zero (including null cells) |
| (a) All usual residents of Australia aged 15 years and over except members of the permanent defence forces, certain diplomatic personnel of overseas governments customarily excluded from census and estimated population counts, overseas residents in Australia, and members of non-Australian defence forces (and their dependants) stationed in Australia. |
| (b) For any group, the number of part-time workers expressed as a percentage of the labour force in the same group. |
| (c) For any group, the labour force expressed as a percentage of the civilian population aged 15 years and over in the same group. |
| Source: Labour Force, Australia, Detailed - Electronic Delivery, Sep 2008 (cat. no. 6291.0.55.001). |
Public policies such as increasing the Age Pension age for women, increasing the minimum age for accessing superannuation benefits and the introduction of incentives for workers who stay on in employment beyond the Age Pension age (e.g. the Pension Bonus Scheme) have encouraged workers to remain in the workforce longer.
3.3 LABOUR FORCE PARTICIPATION RATES, By selected ages and sex, NSW |
|
 | 1997-98 | 1999-2000 | 2001-02 | 2003-04 | 2005-06 | 2007-08 |
| Age group (years) | % | % | % | % | % | % |
Males |
|
| 45-49 | 88.6 | 88.2 | 89.3 | 88.5 | 88.9 | 91.0 |
| 50-54 | 82.3 | 85.3 | 85.2 | 83.9 | 86.1 | 86.7 |
| 55-59 | 70.4 | 71.4 | 71.5 | 72.8 | 73.1 | 74.8 |
| 60-64 | 43.6 | 45.7 | 45.6 | 49.0 | 53.2 | 52.5 |
| 65-69 | 19.2 | 18.7 | 19.7 | 20.8 | 22.4 | 27.7 |
| 70 and over | 6.6 | 5.0 | 5.7 | 5.1 | 6.3 | 7.0 |
Females |
|
| 45-49 | 70.0 | 72.2 | 74.1 | 76.6 | 77.1 | 78.4 |
| 50-54 | 62.5 | 63.9 | 65.6 | 67.5 | 72.8 | 73.4 |
| 55-59 | 40.8 | 45.5 | 49.7 | 52.3 | 54.5 | 57.1 |
| 60-64 | 20.2 | 18.9 | 23.0 | 27.6 | 32.1 | 36.1 |
| 65-69 | 7.8 | 8.4 | 8.8 | 8.9 | 10.7 | 13.9 |
| 70 and over | 1.4 | 1.1 | 1.9 | 1.6 | 1.8 | 2.2 |
Persons |
|
| 45-49 | 79.3 | 80.1 | 81.6 | 82.5 | 82.9 | 84.7 |
| 50-54 | 72.6 | 74.7 | 75.5 | 75.7 | 79.4 | 80.0 |
| 55-59 | 55.8 | 58.6 | 60.8 | 62.7 | 63.8 | 65.9 |
| 60-64 | 31.8 | 32.3 | 34.4 | 38.4 | 42.7 | 44.3 |
| 65-69 | 13.3 | 13.4 | 14.1 | 14.8 | 16.5 | 20.8 |
| 70 and over | 3.5 | 2.8 | 3.5 | 3.1 | 3.7 | 4.3 |
|
| Source: Labour Force, Australia, Detailed - Electronic Delivery (cat. no. 6291.0.55.001). |
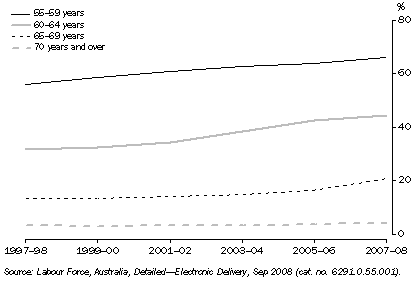
In NSW, older age groups have continued to record lower labour force participation rates over the 10 years to 2007-08. In 2007-08, persons aged 55-59 years recorded a labour force participation rate of 66% whereas persons aged 70 years and over recorded a labour force participation rate of 4.3%.
3.4 LABOUR FORCE PARTICIPATION RATES, By selected ages, NSW

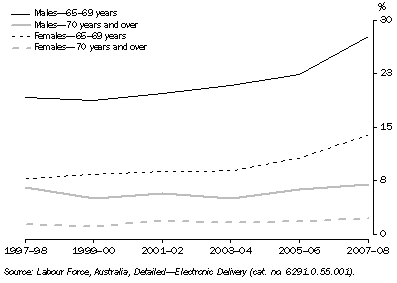
Over the last 10 years, labour force participation rates in NSW have increased for both the 65-69 years and the 70 years and over age groups. The change is more evident for females than males although the rates are smaller. From 1997-98 to 2007-08, participation rates for males aged 65-69 years increased from 19.2% to 27.7% and the participation rates for females of the same age group increased from 7.8% to 13.9%.
3.5 LABOUR FORCE PARTICIPATION RATES, By selected ages and sex, NSW-2007-08

In 2007-08, Agriculture, Forestry and Fishing employed the largest proportion of mature age workers, with 59% of employed persons being aged 45 years and over. Other industries in which a large proportion of mature age workers represented a high proportion of the total employment included Education (51%), Electricity, gas and water supply (49%), Government administration and defence (47%), Health and community services (47%) and Mining (45%). Finance and insurance (28%) employed a small proportion of mature age workers despite being one of the largest industries in NSW. Retail trade and Accommodation, cafes and restaurants (both 28%) were also amongst the industries which employed small proportions of mature age workers.
3.6 PROPORTION OF MATURE AGE WORKERS(a), By industry(c), NSW
- 2007-08

3.3 RETIREMENT
A major impact that the ageing population will have on the economy will be the large proportion of people who will potentially be leaving the workforce due to retirement. In order to better prepare for the potential loss in labour source, it is important for government and businesses to understand the retirement intentions of the maturing population.
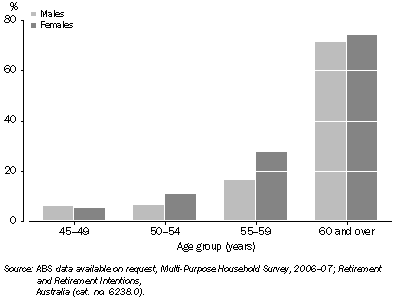
3.7 RETIRED FROM THE LABOUR FORCE, By selected ages and sex, NSW
- 2006-07

In 2006-07, there was a larger proportion of females aged 45 years and over who had retired (43%) than males (38%). In part, this reflects the fact that there are more women in the older age groups and that women tend to retire earlier than men. The proportion of people who were retired increased with age and a larger proportion of females were retired compared to males in nearly all age groups, the largest difference having occurred among people aged 55-59 years (16% for males and 28% for females).
As opportunities and flexibility within the workforce have increased it has become more common for people to reduce working hours and work part-time as a transition to retirement. In 2006-07, 16% of males and 10% of females aged 45 years and over who usually worked full-time intended to retire from full-time employment and work part-time. Further to this, respectively 13% and 6.3% of male and female full-time employed workers in the labour force were not sure if they intended to retire from full-time work and work part-time.
3.8 TRANSITIONS TO RETIREMENT, By selected ages and sex, NSW - 2006-07 |
|
 |  |  |  | Age group (years) |  |
 |  |  |  | 45-49 | 50-54 | 55-59 | 60 and over | Total persons aged 45 years and over |
 |  |  |  | % | % | % | % | % |
Males |
|
| In the labour force |  |  |  |  |  |
 | Employed |  |  |  |  |  |
 |  | Full-time workers |  |  |  |  |  |
 |  |  | Intends to continue with full-time work | 23.8 | 23.6 | 19.0 | 6.0 | 14.7 |
 |  |  | Intends to retire from full-time work and work part-time | 29.2 | 27.7 | 19.8 | 3.9 | 15.6 |
 |  |  | Did not know whether intends to take up part-time work | np | np | 18.7 | 4.3 | 13.2 |
 |  |  | Never intends to retire from full-time work | np | np | 6.6 | 2.3 | 3.4 |
 |  |  | Total full-time workers | 80.0 | 74.8 | 64.0 | 16.6 | 46.9 |
 |  | Part-time workers |  |  |  |  |  |
 |  |  | Intends to retire | 8.7 | 7.3 | 11.5 | 3.7 | 6.6 |
 |  |  | Total part-time workers(a) | 10.4 | 9.3 | 13.6 | 5.5 | 8.4 |
 |  | Total employed | 90.3 | 84.0 | 77.6 | 22.1 | 55.4 |
 | Unemployed | 2.2 | 5.4 | np | np | 1.8 |
 | Total in the labour force | 92.5 | 89.5 | np | np | 57.1 |
| Not in the labour force |  |  |  |  |  |
 | Retired from the labour force(a) | 5.9 | 6.3 | 16.4 | 71.3 | 38.2 |
 | Not retired from the labour force(b) | 0.9 | 3.0 | np | np | 3.8 |
 | Total not in the labour force(c) | 7.5 | 10.5 | 21.1 | 77.5 | 42.9 |
| Total males ('000) | 244.4 | 219.8 | 207.7 | 585.3 | 1 257.3 |
Females |
|
| In the labour force |  |  |  |  |  |
 | Employed |  |  |  |  |  |
 |  | Full-time workers |  |  |  |  |  |
 |  |  | Intends to continue with full-time work | 8.8 | 15.4 | 12.3 | 1.1 | 6.7 |
 |  |  | Intends to retire from full-time work and work part-time | 29.7 | 15.2 | 7.0 | 1.6 | 9.9 |
 |  |  | Did not know whether intends to take up part-time work | np | np | 11.0 | 1.4 | 6.3 |
 |  |  | Never intends to retire from full-time work | np | np | np | 1.2 | 0.9 |
 |  |  | Total full-time workers | 48.7 | 44.3 | 30.4 | 5.3 | 23.8 |
 |  | Part-time workers |  |  |  |  |  |
 |  |  | Intends to retire | 27.3 | 23.1 | 16.7 | 5.1 | 14.1 |
 |  |  | Total part-time workers(a) | 33.8 | 27.1 | 23.2 | 6.7 | 17.8 |
 |  | Total employed | 82.5 | 71.4 | 53.6 | 12.0 | 41.6 |
 | Unemployed | 3.7 | 3.2 | np | np | 2.4 |
 | Total in the labour force | 86.2 | 74.6 | np | np | 44.0 |
| Not in the labour force |  |  |  |  |  |
 | Retired from the labour force(a) | 5.2 | 10.9 | 27.6 | 74.1 | 43.4 |
 | Not retired from the labour force(b) | 5.0 | 7.5 | np | np | 4.4 |
 | Total not in the labour force(c) | 13.8 | 25.4 | 40.5 | 87.6 | 56.0 |
| Total females ('000) | 248.1 | 223.6 | 209.2 | 652.8 | 1 333.8 |
Persons |
|
| In the labour force |  |  |  |  |  |
 | Employed |  |  |  |  |  |
 |  | Full-time workers |  |  |  |  |  |
 |  |  | Intends to continue with full-time work | 16.2 | 19.5 | 15.6 | 3.4 | 10.6 |
 |  |  | Intends to retire from full-time work and work part-time | 29.4 | 21.4 | 13.4 | 2.7 | 12.7 |
 |  |  | Did not know whether intends to take up part-time work | 16.7 | 16.2 | 14.8 | 2.8 | 9.7 |
 |  |  | Never intends to retire from full-time work | 1.9 | 2.3 | 3.3 | 1.7 | 2.1 |
 |  |  | Total full-time workers | 64.2 | 59.4 | 47.1 | 10.6 | 35.0 |
 |  | Part-time workers |  |  |  |  |  |
 |  |  | Intends to retire | 18.0 | 15.3 | 14.1 | 4.4 | 10.4 |
 |  |  | Total part-time workers(a) | 22.2 | 18.3 | 18.4 | 6.1 | 13.2 |
 |  | Total employed | 86.4 | 77.7 | 65.6 | 16.8 | 48.3 |
 | Unemployed | 3.0 | 4.3 | 3.6 | 0.4 | 2.1 |
 | Total in the labour force | 89.3 | 82.0 | 69.2 | 17.2 | 50.4 |
 | Not in the labour force |  |  |  |  |  |
 |  | Retired from the labour force(a) | 5.6 | 8.6 | 22.0 | 72.7 | 40.8 |
 |  | Not retired from the labour force(b) | 3.0 | 5.2 | 5.8 | 3.6 | 4.1 |
 |  | Total not in the labour force(c) | 10.7 | 18.0 | 30.8 | 82.8 | 49.6 |
| Total persons ('000) | 492.6 | 443.5 | 417.0 | 1 238.2 | 2 591.2 |
|
| np not available for publication but included in totals where applicable, unless otherwise indicated |
| (a) Includes those that did not know whether will retire and those that never intend to retire. |
| (b) Includes those who intend to look for or take up full-time and part-time work in the future. |
| (c) Includes those who had never worked. |
| Source: ABS data available on request, Multi-Purpose Household Survey, 2006-07; Retirement and Retirement Intentions, Australia (cat. no. 6238.0). |
 HAVE YOUR SAY
As part of an ongoing evaluation of statistical publications for NSW, we would value your input and assistance in helping to shape future publications to better meet your needs. A short feedback form is linked below for your comments.
Feedback Form
By clicking on this link, you will open a new window, and will be directed to a secure website external to the Australian Bureau of Statistics
 Quality Declaration
  Print Page
 Print All