|
|
LABOUR FORCE STATUS
DECEMBER KEY FIGURES, Western Australia |
|
 | Dec 2010 | Nov 2010 | Dec 2009 |
Trend |
|
| Employed Persons ('000) | 1 224.3 | 1 224.7 | 1 185.7 |
| Unemployment Rate (%) | 4.6 | 4.6 | 5.1 |
| Participation Rate (%) | 68.4 | 68.5 | 68.4 |
Seasonally Adjusted |
|
| Employed Persons ('000) | 1 224.2 | 1 228.3 | 1 188.0 |
| Unemployment Rate (%) | 4.4 | 4.5 | 5.2 |
| Participation Rate (%) | 68.3 | 68.7 | 68.7 |
|
| Source: Labour Force, Australia (cat. no. 6202.0). |
UNEMPLOYED PERSONS
- In December 2010, the unemployment rate for WA remained stable in trend terms (4.6%) and decreased slightly to 4.4% in seasonally adjusted terms. The WA unemployment rate continues to be significantly below the national rate of 5.1% (trend) and 5.0% (seasonally adjusted).
Unemployment Rate: Trend 
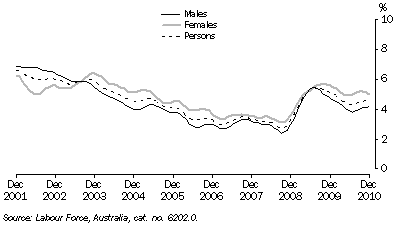
- After climbing above 10% in the early 1990s, WA's unemployment rate generally declined over the following 15 years, reaching a low of 2.7% (trend estimate) by September 2008. Impacted by the global financial crisis, the trend unemployment rate began to rise sharply from October 2008, increasing to 5.5% in July and August 2009. Thereafter, the rate again followed a downward trend until mid-2010, with a slight rise to 4.6% by November 2010. This remained unchanged for December.
- As a consequence of the male-dominated resources boom, the unemployment rate remained lower for males than females from late 2003 for about five years. The economic downturn in late 2008, and associated job losses in mining and mining support activities, resulted in the gap between males and females narrowing briefly, with the unemployment rate for both sexes rising to 5.5% by July 2009.
- The recovery of the labour market from that time to mid-2010 was stronger in the male-dominated industries, causing the gap between male and female unemployment rates to widen again. However, the male unemployment rate rose slightly towards the end of 2010, thereby marginally narrowing the gap. By December 2010, the unemployment rate was 4.2% for men, compared with 5.0% for women.
EMPLOYED PERSONS
Employed Persons

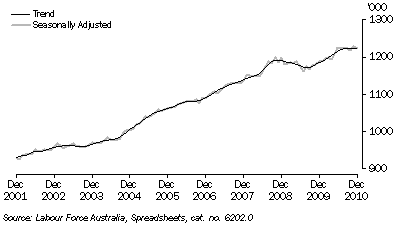
- The number of employed persons fell by 20,600 between November 2008 and August 2009. During this period, when the global financial crisis was having its strongest impact on the WA economy, there was a large fall in full-time employment, which was partially offset by a rise in part-time employment.
- Over the 12 months to December 2010, the trend estimate of employed persons increased by 38,600, comprising 36,500 in full-time employment and 2,100 in part-time employment. Following steady increases in the number of employed persons through much of 2010, the trend has flattened in recent months.
- The relatively unchanged trend estimate for employed persons was a result of the fall in seasonally adjusted terms that partly offset previous increases. In December 2010, the monthly seasonally adjusted figure decreased by 4,100. This was driven down by a drop in full-time jobs (6,000).
This link provides access to time series spreadsheets from Labour Force, Australia, December 2010 (cat. no 6202.0). The statistics provided in this overview are taken from Table 8, which is one of several tables containing data for WA.
|
|
 Print Page
 Print All