GRAPHS
Household final consumption expenditure, (from Table 3.1) Seasonally adjusted
- Chain volume measures
: Quarterly % change
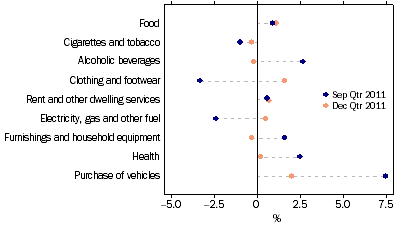 Source: Australian National Accounts: National Income, Expenditure and Product, (cat. no. 5206.0)
Household final consumption expenditure, (from Table 3.1) Seasonally adjusted - Chain volume measures: Quarterly % change
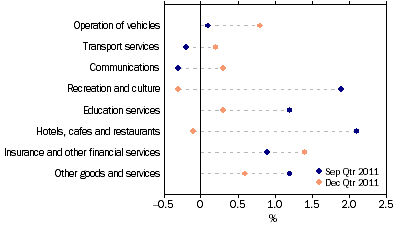
Source: Australian National Accounts: National Income, Expenditure and Product, (cat. no. 5206.0)
Retail Trade, (from Table 3.2) Chain volume measures-Percentage change from previous qtr
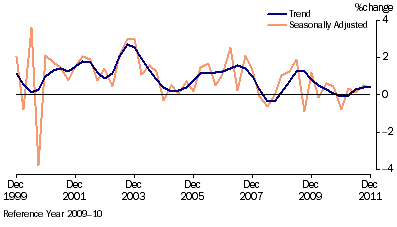
Source: Retail Trade, Australia, (cat. no. 8501.0)
Retail Turnover, (from Table 3.3) Percentage change from previous month
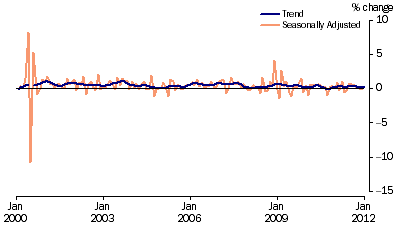
Source: Retail Trade, Australia, (cat. no. 8501.0)
Private gross fixed capital formation, (from Table 3.4) Seasonally adjusted - Chain volume measures
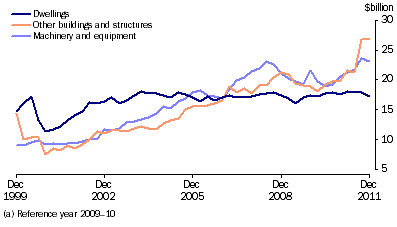
Source: Australian National Accounts: National Income, Expenditure and Product, (cat. no. 5206.0)
New motor vehicle sales, (from Table 3.8) Total vehicles - Long term
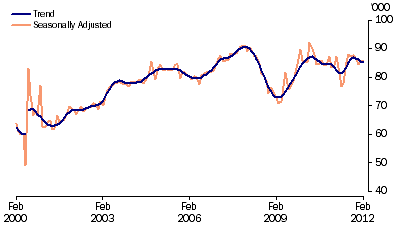
Source: Sales of New Motor Vehicles, Australia, (cat. no. 9314.0)
 Print Page