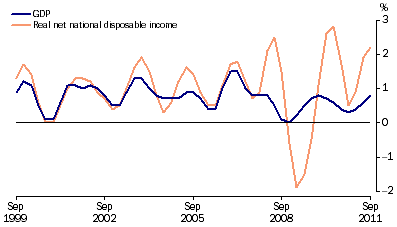
GDP and real net national disposable income, (from Table 1.1) Chain volume measures, Trend
- Quarterly % change
 Source: Australian National Accounts: National Income, Expenditure and Product, (cat. no. 5206.0)
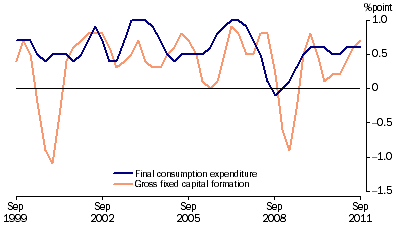
Contributions to growth in GDP, (from Table 1.2) Chain volume measure, Trend
Source: Australian National Accounts: National Income, Expenditure and Product, (cat. no. 5206.0)
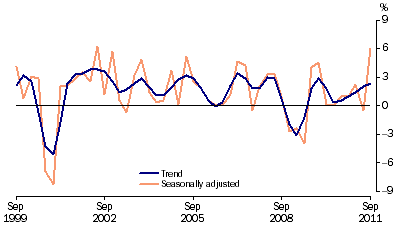
Total gross fixed capital formation (GFCF), (from Table 1.2) Chain volume measure-Quarterly % change
Source: Australian National Accounts: National Income, Expenditure and Product, (cat. no. 5206.0)
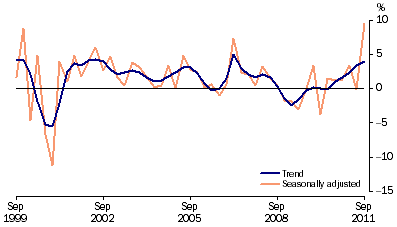
Private GFCF, (from Table 1.2) Chain volume measure, Trend - Quarterly % change
Source: Australian National Accounts: National Income, Expenditure and Product, (cat. no. 5206.0)
Private GFCF: selected components, (from Table 1.2) Chain volume measure, Trend-Quarterly % change
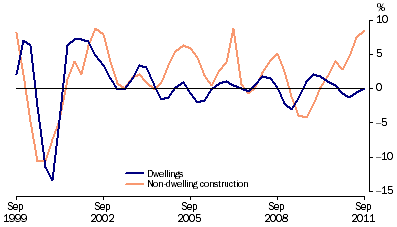
Source: Australian National Accounts: National Income, Expenditure and Product, (cat. no. 5206.0)
Labour productivity (proxy) trend, (from Table 1.6) GDP Market sector, Chain volume measure-Quarterly % change
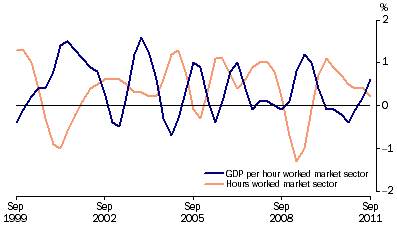
Source: Australian National Accounts: National Income, Expenditure and Product, (cat. no. 5206.0)
GFS Net operating balance, (from Table 1.7) - 2008-09 and 2009-10
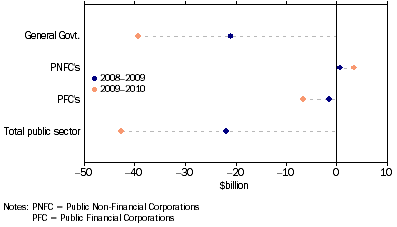
Source: Government Finance Statistics, Australia, (cat. no. 5512.0) and Public Finance section
Total public sector, (from Table 1.7) Net lending/borrowing as a percentage of GDP
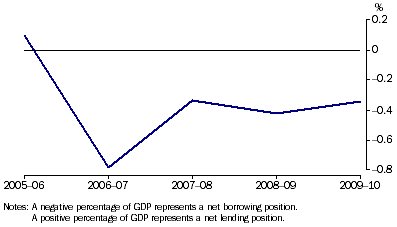
Source: Government Finance Statistics, Australia, (cat. no. 5512.0) and Public Finance section