1308.8 - In fACT - Statistical Information on the ACT and Region, Feb 2009  
ARCHIVED ISSUE Released at 11:30 AM (CANBERRA TIME) 27/02/2009   
   Page tools: Print Print Page  
Contents >> Key indicators

KEY INDICATORS


POPULATION

ESTIMATED RESIDENT POPULATION

Australian Capital Territory
Australia

Jun Qtr 08
Estimated resident population persons
p344 236
p21 373 998
Percentage change from previous quarter %
p0.5
p0.4

p preliminary figure or series subject to revision
Source: Australian Demographic Statistics (cat. no. 3101.0).

MEDIAN AGE OF POPULATION(a)

Australian Capital Territory
Australia(b)
years
years

30 June 2008
34.7
36.9

(a) The median age indicates the age at which half the population is older and half younger.
(b) Australia includes Other Territories.
Source: Population by Age and Sex, Australian States and Territories (cat. no. 3201.0).


EDUCATION

SCHOOLS, By category

Government
Non-government
All schools
no.
no.
no.

Australian Capital Territory
2006
95
44
139
2007
88
44
132

Source: Schools, Australia (cat. no. 4221.0).

STUDENTS

Australian Capital Territory
Australia
no.
no.

2006
59 767
3 393 242
2007
59 566
3 441 026

Source: Schools, Australia (cat. no. 4221.0).

APPARENT RETENTION RATES, Full-time students

Australian Capital Territory
Australia
%
%

Year 7/8 to Year 12
2006
88.7
74.7
2007
85.2
74.3

Source: Schools, Australia (cat. no. 4221.0).

EDUCATION PARTICIPATION AND ATTAINMENT, NON-SCHOOL - 2008

Australian Capital Territory
Australia
'000
'000

Students
54
2 576
Non-school qualification(a)
Persons with a non-school qualification
145
7 472
Persons without a non-school qualification
88
6 379
Total persons aged 15-64 years
233
13 851

(a) Non-school qualification refers to educational attainments other than those of pre-primary, primary or secondary education.
Source: Education and Work, Australia (cat. no. 6227.0).


CRIME

PRISONERS

2008

Prisoner counts
Australian Capital Territory
250
Australia
27 615
Crude imprisonment rate(a)
Australian Capital Territory
94
Australia
169

(a) Imprisonment rates are expressed as the number of persons in prison per 100,000 adult population.
Source: Prisoners in Australia (cat. no. 4517.0).

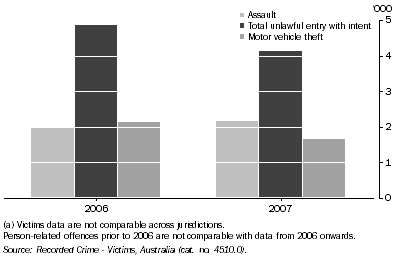
VICTIMS, Australian Capital Territory

Graph: VICTIMS, Australian Capital Territory


TOURISM

TOURIST ACCOMMODATION: Hotels, motels and serviced apartments with 15 or more rooms

Establishments
Takings from accommodation
Room occupancy rate
no.
$'000
%

Australian Capital Territory
Sep Qtr 07
56
50 520
76.8
Sep Qtr 08
56
52 482
69.1

Source: Tourist Accommodation, Australia (cat. no. 8635.0).


CONSUMER PRICE INDEX

CONSUMER PRICE INDEX

Canberra
Weighted average of 8 capital cities
%
%

Dec Qtr 08
Percentage change from previous period
-0.4
-0.3
Percentage change from corresponding quarter of previous year
3.7
3.7

Source: Consumer Price Index, Australia (cat. no. 6401.0).


NATIONAL ACCOUNTS

STATE FINAL DEMAND(a): Chain volume measures

State final demand
Percentage change from previous quarter
$m
%

Australian Capital Territory
Dec Qtr 07
9 444.0
-
Mar Qtr 08
9 474.0
0.3
Jun Qtr 08
9 529.0
0.6
Sep Qtr 08
9 578.0
0.5

- nil or rounded to zero (including null cells)
(a) Reference year for chain volume measures is 2006-07.
Source: Australian National Accounts: National Income, Expenditure and Product (cat. no. 5206.0).


LABOUR FORCE

LABOUR FORCE STATUS(a): Trend

October 2008
November 2008
December 2008

Australian Capital Territory
Employed
Total persons '000
192.1
192.3
192.5
Change from previous month '000
0.2
0.2
0.2
Percentage change from previous year %
2.1
2.0
1.9
Unemployed
Total persons '000
5.3
5.3
5.2
Change from previous month '000
-0.1
-
-
Percentage change from previous year %
10.6
11.0
8.7
Australia
Employed
Total persons '000
10 742.6
10 747.4
10 749.4
Change from previous month '000
6.2
4.8
2.0
Percentage change from previous year %
1.8
1.6
1.3
Unemployed
Total persons '000
487.5
493.0
498.1
Change from previous month '000
5.2
5.6
5.1
Percentage change from previous year %
2.6
4.7
7.1

- nil or rounded to zero (including null cells)
(a) Persons aged 15 years and over.
Source: Labour Force, Australia (cat. no. 6202.0).

LABOUR FORCE STATUS(a): Trend

October 2008
November 2008
December 2008

Australian Capital Territory
Participation rate
Rate %
72.6
72.6
72.6
Change from previous month % pts
-
-
-
Change from previous year % pts
0.5
0.6
0.5
Unemployment rate
Rate %
2.7
2.7
2.6
Change from previous month % pts
-
-
-
Change from previous year % pts
0.2
0.2
0.2
Australia
Participation rate
Rate %
65.1
65.1
65.0
Change from previous month % pts
-
-
-
Change from previous year % pts
-
-0.1
-0.2
Unemployment rate
Rate %
4.3
4.4
4.4
Change from previous month % pts
-
-
-
Change from previous year % pts
-
0.1
0.2

- nil or rounded to zero (including null cells)
(a) Persons aged 15 years and over.
Source: Labour Force, Australia (cat. no. 6202.0).


RETAIL TRADE

For information about retail trade please refer to the Journal of fACTS in the Economy section.


BUILDING APPROVALS

BUILDING APPROVALS: Trend

Australian Capital Territory
Australia

October 2008
Number of dwelling units no.
202
10 726
Percentage change from previous month %
-10.2
-5.2
November 2008
Number of dwelling units no.
182
10 187
Percentage change from previous month %
-10.0
-5.0
December 2008
Number of dwelling units no.
151
9 692
Percentage change from previous month %
-16.6
-4.9

Source: Building Approvals, Australia (cat. no. 8731.0).


HOUSING FINANCE

HOUSING FINANCE FOR OWNER OCCUPATION, Total new housing commitments: Trend

Number of Commitments
Value of Commitments
no.
$'000

September 2008
Australian Capital Territory
705
187 960
Australia
48 551
12 181 188
October 2008
Australian Capital Territory
708
189 683
Australia
48 279
12 188 613
November 2008
Australian Capital Territory
711
190 956
Australia
48 271
12 237 395

Source: Housing Finance, Australia (cat. no. 5609.0).


HOUSE PRICE INDEX

ESTABLISHED HOUSE PRICES

Canberra
Weighted average of 8 capital cities
%
%

Dec Qtr 08
Percentage change from previous quarter to current quarter
0.7
-0.8
Percentage change from corresponding quarter of previous year
-4.1
-3.3

Source: House Price Indexes: Eight Capital Cities (cat. no. 6416.0).


Previous PageNext Page