BALANCE OF PAYMENTS (BOP)
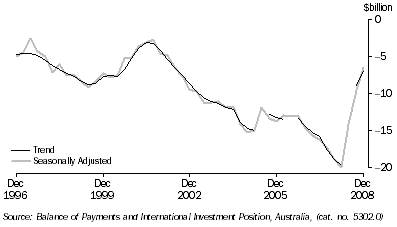
Balance on current account, (from Table 2.1)

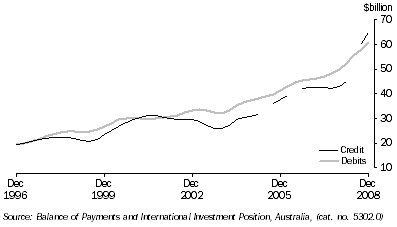
Goods, (from Table 2.1) Trend

Balance of payments, Current account |
|
| Period | Balance on current account | Balance on goods and services | Goods | Goods credits | Goods debits | Services | Income | Current transfers |
Annual ($ million)(a) |
|
| 2005-06 | -52 839 | -14 520 | -15 291 | 154 425 | -169 716 | 771 | -37 670 | -649 |
| 2006-07 | -58 999 | -12 757 | -14 510 | 169 514 | -184 024 | 1 753 | -45 903 | -339 |
| 2007-08 | -70 297 | -21 147 | -21 988 | 183 058 | -205 046 | 841 | -48 837 | -313 |
Seasonally adjusted ($ million)(b) |
|
| 2006-2007 |  |  |  |  |  |  |  |  |
 | December | -14 662 | -3 090 | -3 534 | 42 324 | -45 858 | 445 | -11 528 | -45 |
 | March | -15 671 | -3 789 | -4 284 | 42 486 | -46 770 | 495 | -11 807 | -75 |
 | June | -16 155 | -4 077 | -4 510 | 42 645 | -47 155 | 433 | -11 979 | -100 |
| 2007-2008 |  |  |  |  |  |  |  |  |
 | September | -17 387 | -5 483 | -5 739 | 42 217 | -47 956 | 256 | -11 868 | -37 |
 | December | -18 914 | -6 565 | -6 724 | 42 387 | -49 111 | 159 | -12 247 | -102 |
 | March | -19 945 | -7 658 | -7 865 | 45 056 | -52 921 | 207 | -12 203 | -84 |
 | June | -14 139 | -1 501 | -1 699 | 53 329 | -55 028 | 198 | -12 548 | -90 |
| 2008-2009 |  |  |  |  |  |  |  |  |
 | September | -9 498 | 1 429 | 1 406 | 60 272 | -58 867 | 23 | -10 848 | -79 |
 | December | -6 499 | 4 086 | 4 487 | 66 094 | -61 608 | -400 | -10 442 | -143 |
|
| (a) The estimates for goods and services are not necessarily consistent with the corresponding monthly estimates, shown in tables 2.4 to 2.7 obtained from International Trade in Good and Services, Australia, (cat. no. 5368.0) issued monthly, due to data revisions to the original monthly data not feeding into the quarterly original series until the next quarterly release of Balance of Payments and International Investment Position, Australia, (cat. no. 5302.0). |
| (b) In addition to the differences outlined in footnote (a), the quarterly seasonally adjusted estimates for goods and services are not necessarily consistent with corresponding monthly seasonally adjusted estimates, shown in table 2.4 due to the independent seasonal adjustment of the Quarterly and Monthly data. |
| Source: Balance of Payments and International Investment Position, Australia, (cat. no. 5302.0) |
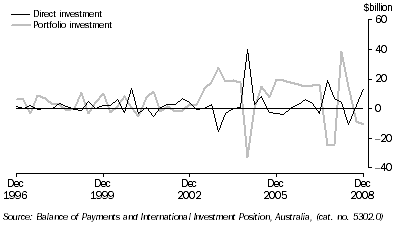
Financial account, (from Table 2.2) Selected types of investment

Balance of payments, Capital and financial account |
|
| Period | Capital and finan-
cial account | Capital account | Finan-
cial account | Direct invest-
ment net | Direct invest-
ment abroad | Direct invest-
ment in Australia | Portfolio invest-
ment | Finan-
cial deriva-
tives | Other invest-
ment | Reserve assets | Net errors and omis-
sions |
Annual ($ million) |
|
| 2005-06 | 52 643 | 1 726 | 50 917 | -10 941 | -31 758 | 20 817 | 63 764 | -1 328 | 5 027 | -5 605 | 196 |
| 2006-07 | 59 103 | 2 380 | 56 723 | 8 924 | -31 232 | 40 156 | 63 814 | 3 575 | 537 | -20 127 | -104 |
| 2007-08 | 70 711 | 2 176 | 68 535 | 18 916 | -38 880 | 57 796 | 4 731 | -9 450 | 10 046 | 44 292 | -414 |
Quarterly Original ($ million) |
|
| 2006-2007 |  |  |  |  |  |  |  |  |  |  |  |
 | December | 15 169 | 910 | 14 259 | 5 787 | -8 070 | 13 857 | 15 405 | 1 530 | 2 038 | -10 501 | -331 |
 | March | 15 315 | 539 | 14 776 | 3 492 | -8 858 | 12 350 | 15 489 | 204 | -2 832 | -1 577 | 28 |
 | June | 14 167 | 381 | 13 786 | -3 211 | -3 927 | 716 | 16 545 | 657 | 9 906 | -10 111 | 371 |
| 2007-2008 |  |  |  |  |  |  |  |  |  |  |  |
 | September | 18 901 | 566 | 18 335 | 18 883 | -20 491 | 39 374 | -25 002 | -1 393 | -2 234 | 28 081 | -144 |
 | December | 20 063 | 462 | 19 601 | 6 660 | 7 638 | -978 | -24 100 | -14 600 | 28 046 | 23 595 | -257 |
 | March | 19 433 | 602 | 18 831 | 3 947 | -10 750 | 14 697 | 38 691 | 2 052 | -20 462 | -5 397 | -357 |
 | June | 12 314 | 546 | 11 768 | -10 574 | -15 277 | 4 703 | 15 142 | 4 491 | 4 696 | -1 987 | 344 |
| 2008-2009 |  |  |  |  |  |  |  |  |  |  |  |
 | September | 10 725 | 783 | 9 942 | 1 767 | -10 142 | 11 909 | -8 357 | -6 272 | 17 722 | 5 082 | 70 |
 | December | 7 657 | 601 | 7 056 | 13 770 | -7 611 | 21 381 | -10 877 | 6 041 | 310 | -2 188 | 15 |
|
| Source: Balance of Payments and International Investment Position, Australia, (cat. no. 5302.0) |
 Print Page
 Print Page