YOUTH OFFENDERS
The number of offenders aged 10 to 19 years proceeded against by police decreased by 4.6% (5,106) between 2009-10 and 2010-11 to 104,832 offenders. Youth offenders comprised just over a quarter (28%) of the total offender population, well above this age group's proportion in the Australian Estimated Resident Population (15%). The over-representation of youth as offenders is reflected in the youth offender rate of 3,616 offenders per 100,000 persons aged 10 to 19 years. (Table 2.8 and 2.9)
Offender rates increased for each year of age from 10 years (270 offenders per 100,000 persons aged 10 years) to peak at 18 years of age (6,401 offenders per 100,000 persons aged 18 years). The greatest increase occurred between those aged 12 years and 13 years where the offender rate doubled, from 975 offenders per 100,000 persons aged 12 years to 2,012 offenders per 100,000 persons aged 13 years. (Table 2.7)
Sex
Of the offenders aged 10 to 19 years, the offender rates for females were consistently much lower than the offender rates for males, and the peak offender rate occurred at an earlier age for females than males. The peak offender rate for females was at the age of 16 years (3,120 female offenders per 100,000 females aged 16 years), which was almost four times higher than the rate for all female offenders (834 female offenders per 100,000 females aged 10 years and over). For males, the peak offender rate was at age 18 years (9,925 male offenders per 100,000 males aged 18 years), which was more than three times higher than the rate of all male offenders (2,959 male offenders per 100,00 males aged 10 years and over). (Table 2.7)
Principal offence
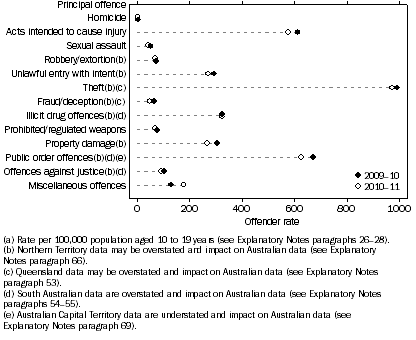
The predominant principal offences for youth offenders were Theft (974 offenders per 100,000 persons aged 10 to 19 years), Public order offences (626 offenders per 100,000 persons aged 10 to 19 years) and Acts intended to cause injury (575 offenders per 100,000 persons aged 10 to 19 years). Between 2009-10 and 2010-11, the largest decreases in youth offending rates were for the principal offences of Public order offences (a decrease of 45 offenders per 100,000 persons aged 10 to 19 years), Acts intended to cause injury (a decrease of 38 offenders per 100,000 persons aged 10 to 19 years), and Property damage (a decrease of 37 offenders per 100,000 persons aged 10 to 19 years). During this same period, increased rates of youth offending were evident for Miscellaneous offences (an increase of 47 offenders per 100,000 persons aged 10 to 19 years). (Table 2.9)
Youth offender rate(a), Selected principal offence
- 2009-10 to 2010-11

Variations in patterns of youth offending by age are illustrated by the following graph. From the age of 12 years there was a noticeable increase in the rate at which Theft was the predominant principal offence for youth offenders, peaking at the age of 16 years. For those aged 18 years, Public order offences had replaced both Theft and Acts intended to cause injury as the most prevalent principal offence. The rate at which youth were proceeded against by police for Illicit drug offences continued to increase for each year of age from 10 to 19 years, whereas offender rates for the three remaining offences had peaked and started to decrease prior to the age of 19 years. (Table 2.9)
Youth offender rate(a), Selected principal offence by age

 Print Page
 Print All