Land Management and Farming in Australia
Information on Australian agricultural businesses management practices, including soil enhancers, fertiliser use, cropping and pasture management
Reference period
2016-17 financial year
Land use
Land use on farms, Australia, year ended 30 June 2017
Key points
- Agricultural businesses operated across just over half (51%) of Australia's total land area during 2016-17.
- At 30 June 2017 there were 394 million hectares of agricultural land in Australia, a 6% increase on the previous year. Coinciding with this increase in agricultural land, there were 2,400 more agricultural businesses at 30 June 2017, a 3% increase on 2015-16 estimates.
- Favourable weather conditions across much of the country saw the area of land used for crops in Australia increase to 31 million hectares in 2016-17. The increase was driven by South Australia and Western Australia, up 8% and 4% respectively on last year's estimate. South Australia, in particular, saw a resurgence in agriculture production after a poor year in 2015-16 with record high yields for many crops and farmers taking advantage of the conditions by planting additional areas of crops.
- Of the 394 million hectares of land operated by agricultural businesses in Australia, 341 million hectares (or 87%) was used for grazing, a 9% increase when compared to 2015-16. An estimated 65,000 agricultural businesses (or 74%) of all agricultural businesses, reported grazing land, a 6% increase from the previous year.
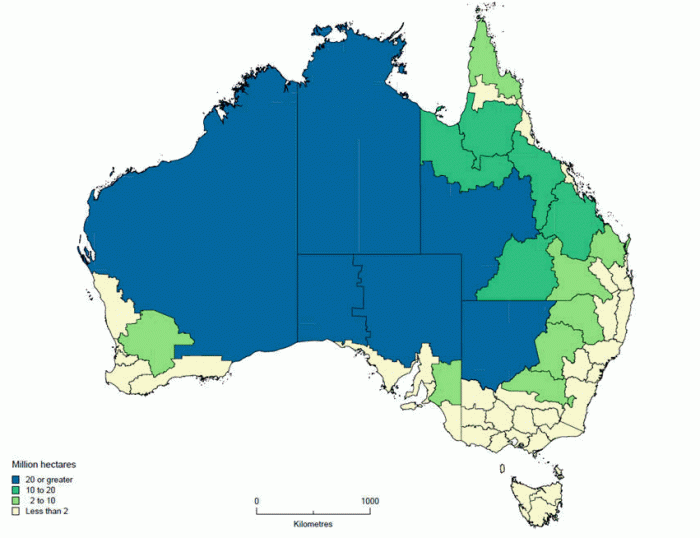
- Queensland continues to be the largest contributor to the area of grazing land, with an estimated 129 million hectares of land used for grazing in 2016-17.
Grazing land area, hectares (millions), 2016-17 by National Resource Management regions
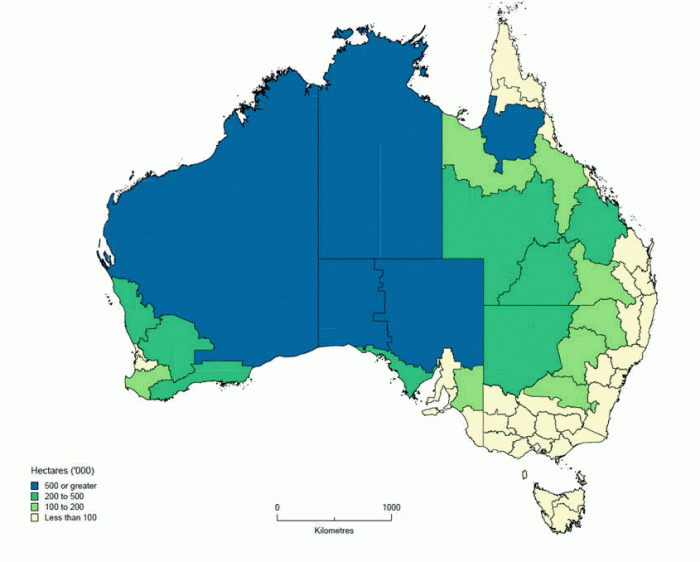
Area set aside for conservation or protection purposes, hectares ('000), 2016-17 by National Resource Management regions
Crop and pasture management
Crop and pasture management, Australia, year ended 30 June 2017
Key points
- Agricultural businesses reported cultivating 23 million hectares of land for crops and/or pasture during 2016-17, a 935,000 hectare (or 4%) increase on 2015-16. The most common land cultivation practice for crops and pasture continues to be zero or minimum till where farmers undertake no cultivation apart from sowing or planting.
- Of the 20 million hectares of crop land cultivated 79% (or 16 million hectares) received no cultivation, apart from sowing or planting, a 16% increase on 2015-16. Similarly, 70% (or 2 million hectares) of the 3 million hectares of pasture land cultivated received no cultivation, apart from sowing, which was a 33% decrease in area on the 2015-16 estimate.
- Western Australia continues to have the largest area of land cultivated for crops and/or pastures, with 8 million hectares, followed closely by New South Wales (including the ACT) with 6 million hectares.
- Nationally, 5,000 agricultural businesses undertook some form of intercropping practices on 850 thousand hectares of land in 2016-17. While the number of business undertaking intercropping increased by 5% the area on which intercropping practices were undertaken decreased by 20%, driven by a 32% drop in Victoria's area of intercropping (down to 206,400 hectares). New South Wales (incuding the ACT) continues to be the main state reporting intercropping practices with 320 thousand hectares, or 38% of the nation's total area on which intercropping was undertaken.
- The area on which Mixed inter-row/strip cropping was undertaken decreased to 359,700 hectares (down 38%) in 2016-17. Despite this fall, it remained the most common form of intercropping, accounting for 42% of agricultural land using any form of intercropping, down from 55% in 2015-16.
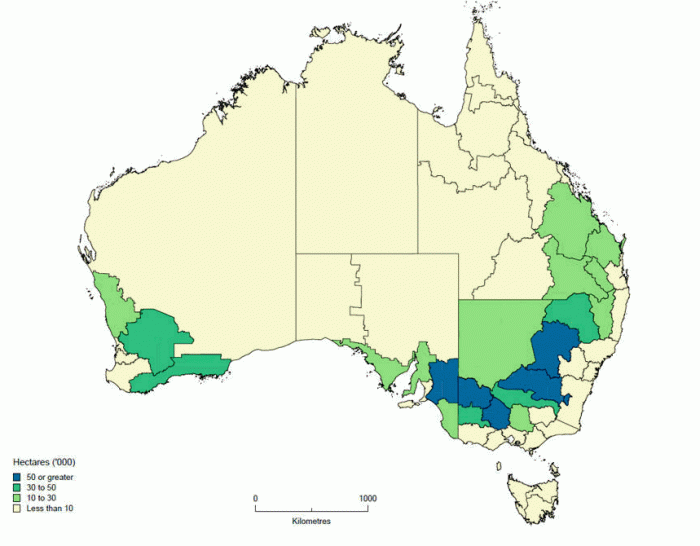
Total area of intercropping undertaken by hectares ('000), 2016-17 by Natural Resource Management regions
Crop stubble and/or trash management practices
Crop stubble and/or trash management practices, Australia, year ended 30 June 2017
Key points
- In 2016-17 an estimated 25,600 agricultural businesses undertook some form of crop stubble and/or trash management practices over an area of 21 million hectares.
- The most common crop stubble and trash management practices were retained on ground, undertaken on 5.8 million hectares of crops; retained standing, undertaken on 5.3 million hectares; and grazed off , undertaken on 3 million hectares.
- Western Australia had the largest area on which crop stubble and/or trash management practices were carried out (6.4 million hectares). New South Wales (including the ACT) had the second largest area, with 5.6 million hectares.
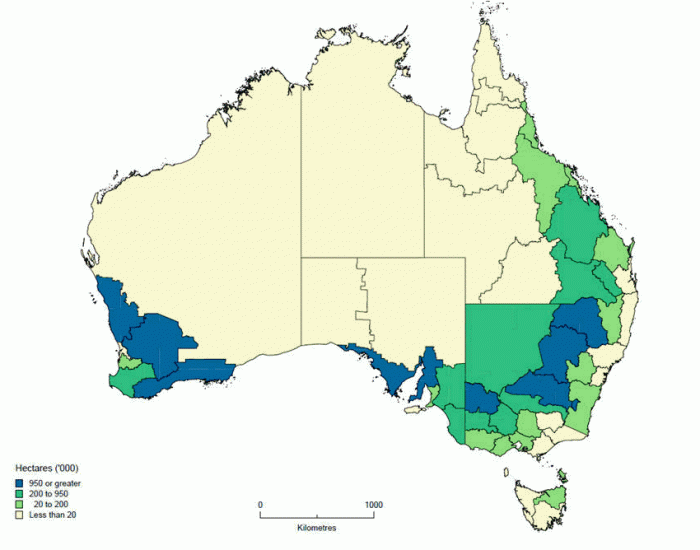
Crop stubble and/or trash management, hectares ('000), 2016-17 by Natural Resource Management regions
Soil enhancer use
Soil enhancer use, Australia, year ended 30 June 2017
Key points
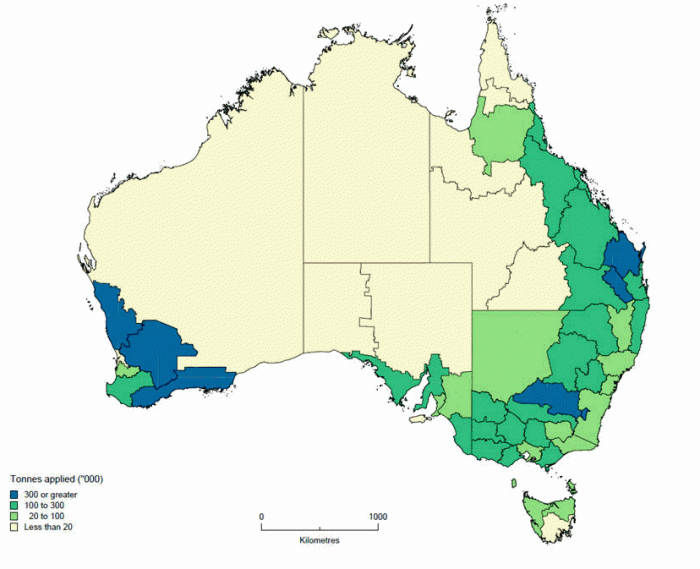
- Of all agricultural businesses in Australia, 33% (or 28,800) applied soil enhancers on 5 million hectares of land in 2016-17. There was a 26% increase in the number of agricultural businesses applying soil enhancers. Despite this, the area that soil enhancers were applied to decreased slightly (down 1%) compared to 2015-16.
- New South Wales (including the ACT) continued to have the largest number of businesses applying soil enhancers in 2016-17 with 8,100 businesses, a 22% increase since 2015-16.
- Western Australia continued to have the largest area to which soil enhancers were applied with 1.7 million hectares followed by New South Wales (including the ACT) with 1.2 million hectares.
- Lime (including lime sand and stone) continues to be the dominant soil enhancer used by both area of application and number of businesses applying it. Used to reduce soil acidity, the area on which lime was applied (2.2 million hectares) in 2016-17 accounted for 47% of the total area on which all soil enhancers were applied and was applied by 14,500 businesses, or half of all businesses applying soil enhancers.
- Agricultural businesses in Western Australia continue to be the largest users of lime, applying it to 1.2 million hectares of land in 2016-17.
All soil enhancers applied, tonnes ('000), 2016-17 by Natural Resource Management regions
Fertiliser use
Fertiliser use, Australia, year ended 30 June 2017
Key points
- An estimated 57,300 agricultural businesses applied 5 million tonnes of fertiliser to a total of 50 million hectares of agricultural land across Australia in 2016-17, a 4% decrease in the area to which fertilisers were applied.
- By area, ammonium phosphates continued to be the most widely used fertiliser in 2016-17. However, the area to which it was applied decreased by 8% to 13 million hectares and the tonnes applied decreased by 14% to 963,000 tonnes.
- Urea continues to be the most applied fertiliser in 2016-17, both by the amount applied and the number of businesses using it. While the area on which urea was applied decreased 5% to 11 million hectares, the amount applied was virtually unchanged from 2015-16 at 1.4 million tonnes. Nationally, 21,800 agricultural businesses applied urea in 2016-17, a 2% decrease from 2015-16.
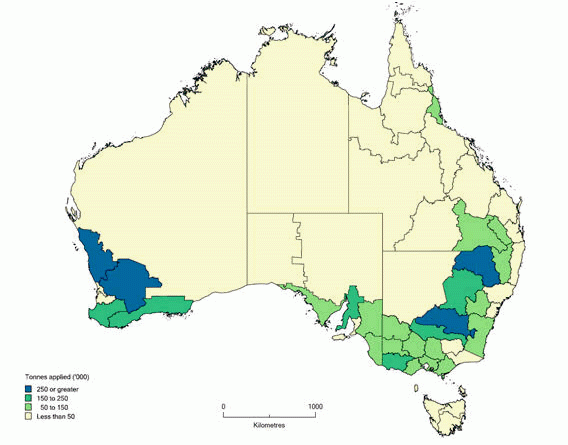
- Agricultural businesses in Western Australia continued to fertilise the largest areas of land with 19 million hectares reported in 2016-17 or 37% of Australia's total area of agricultural land fertilised. Both Western Australia and New South Wales (including the ACT) used the largest amounts of fertiliser during 2016-17 with both applying just over 1 million tonnes.
All fertiliser applied by tonnes ('000), 2016-17 by Natural Resource Management regions
Data downloads
Land management and farming in Australia, state and territory and NRM - 2016-17
Land management and farming in Australia, state and territory and NRM - 2016-17 (.csv file)
Survey material
To view the 2016-17 Rural Environment and Agricultural Commodities Survey sample form click here
To view Maps: Land management and farming in Australia click here
Previous catalogue number
This release previously used catalogue number 4627.0.
