CAPITAL EXPENDITURE
In 2010-11, the estimate of capital expenditure accounted for 17% of all state and territory funded cultural expenditure and remains similar to the proportions in previous years (18% and 16% in 2009-10 and 2008-09 respectively). The governments of Western Australia and the Australian Capital Territory allocated the highest proportions of total cultural expenditure to capital projects in 2010-11 with 22% and 21% respectively. (Tables 3 and 4)
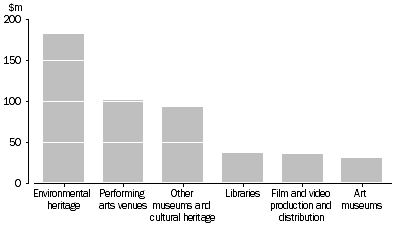
Environmental heritage ($182.8m), Performing arts venues ($101.4m) and Other museums and cultural heritage ($93.9m) accounted for 70% of total capital expenditure in 2010-11. Since 2009-10, fluctuations in capital expenditure were experienced in specific categories. In particular, the estimate of capital expenditure on Environmental heritage fell 26%. This was offset by expenditure increases on Film and video production and distribution (221%), Design (up from $0.2m to $21.6m) and Performing arts venues (21%).
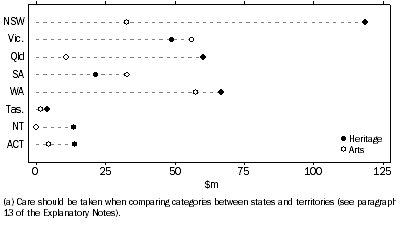
Of all the state and territory governments, the New South Wales Government had the highest estimate for capital expenditure on Heritage activities ($118.6m) and the Western Australian Government had the highest estimate for capital expenditure on Arts activities ($57.5m).
STATE AND TERRITORY GOVERNMENT CAPITAL CULTURAL EXPENDITURE - 2010-11

STATE AND TERRITORY GOVERNMENT CAPITAL CULTURAL EXPENDITURE(a), By Heritage and Arts
- 2010-11

 Print Page
 Print All
 Print Page
 Print All