Self-assessed health status provides an indicator of overall health; it reflects an individual’s perception of his or her own health. As this measure is dependent on an individual’s awareness and expectations regarding their health, it may be influenced by factors such as access to health services and health information. Cunningham and colleagues (1997) examined the robustness of this measure and found that factors such as language spoken and employment status can have an effect on how individuals describe their health.
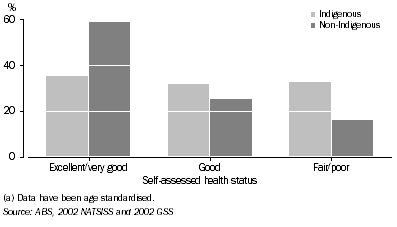
In the 2002 National Aboriginal and Torres Strait Islander Social Survey (NATSISS) around 42% of Indigenous people aged 18 years or over reported their health as very good or excellent, 33% reported their health as good and 25% reported their health as fair or poor. After adjusting for differences in age structure, Indigenous Australians were twice as likely to report their health as fair or poor than non-Indigenous Australians (graph 7.1) (ABS 2004f). This was similar to estimates from the 2001 National Health Survey (NHS) which showed that, after adjusting for different age structures in the Indigenous and non-Indigenous populations, Indigenous Australians aged 15 years or over were almost twice as likely to report fair or poor health as non-Indigenous Australians (ABS 2002b).
7.1 Self-assessed health status(a), Persons aged 18 years or over - 2002

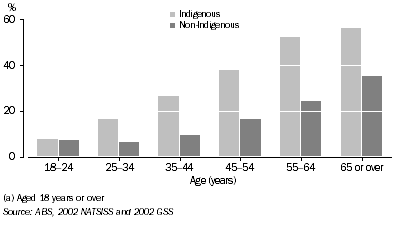
Indigenous people were more likely to report fair or poor health than non-Indigenous people at all ages, with the exception of those aged 18-24 years (graph 7.2). The proportion of Indigenous people reporting fair or poor health increased with age, from 8% of people aged 18-24 years to 56% of people aged 65 years or over. Indigenous Australians living in remote areas were less likely to report fair or poor health (22%) than those in non-remote areas (27%).
7.2 Persons(a) with fair or poor self-assessed health, by Indigenous status - 2002

Changes in self-assessed health status between 1994 and 2002
There has been no significant change between 1994 and 2002 in the proportion of Indigenous Australians who reported their health as excellent or very good. There has, however, been a decrease in reported good health overall, and an increase in reported fair or poor health between 1994 and 2002 for both males and females (table 7.3).
7.3 Self-assessed health status, Indigenous persons aged 15 years or over - 1994 and 2002 |
|  |
 |  | 1994 | 2002 |  |
 |  | Males | Females | Persons | Males | Females | Persons |  |
|  |
| Excellent/very good | % | (a)48.8 | (a)42.1 | (a)45.3 | (a)47.1 | (a)41.3 | (a)44.1 |  |
| Good | % | (a)32.8 | 40.9 | 37.1 | (a)30.1 | 34.6 | 32.4 |  |
| Fair/poor | % | 18.1 | 16.8 | 17.5 | 22.5 | 24.0 | 23.3 |  |
| Total(b) | no. | 102 200 | 112 400 | 214 600 | 135 200 | 147 000 | 282 200 |  |
|  |
| (a) Differences between 1994 and 2002 are not statistically significant. |
| (b) Includes persons who did not report their health status. |
| ABS, 1994 NATSIS and 2002 NATSISS |
The proportion of Indigenous Australians who reported fair or poor health was higher in 2002 (23%) than in 1994 (18%). The Australian Capital Territory had the largest increase in the proportion of people reporting fair or poor health between 1994 and 2002 (6% to 18%), followed by Western Australia (16% to 24%) and Queensland (17% to 24%).
Self-assessed health and socioeconomic factors
Indigenous Australians living in the poorest households (those in the lowest quintile for mean equivalised gross household income per week) were more likely to report fair or poor health than those in households receiving the highest incomes. Indigenous males and females who had completed Year 12 were less likely to report fair or poor health (15% of males and 14% of females) than those who had only completed Year 9 or below (36% of males and 37% of females).
Indigenous males and females who had completed Year 12 or equivalent were twice as likely to report fair or poor health as their non-Indigenous counterparts. However, Indigenous males and females who had only completed Year 9 or below and those in the poorest households (lowest quintile of equivalised gross household income per week) reported only slightly higher levels of fair or poor health than non-Indigenous males and females (table 7.4).
7.4 Socioeconomic characteristics, Indigenous persons aged 18 years or over - 2002 |
|  |
 |  | Proportion with fair/poor health | Rate Ratio(a) |  |
 |  | Males | Females | Persons | Males | Females | Persons |  |
 |  | % | % | % | rate | rate | rate |  |
|  |
| Equivalised gross household income(b) |  |  |  |  |  |  |  |
 | Lowest quintile | 31.4 | 32.9 | 32.3 | 1.0 | 1.3 | 1.2 |  |
 | Second quintile | 26.1 | 24.6 | 25.3 | 1.4 | 1.5 | 1.5 |  |
 | Third quintile | 12.4 | 22.7 | 17.7 | 1.4 | 2.7 | 2.1 |  |
 | Fourth quintile | *15.1 | 10.0 | 12.8 | 2.1 | 1.6 | 1.9 |  |
 | Fifth quintile | *9.9 | *15.9 | *13.1 | 1.8 | 3.3 | 2.5 |  |
| Highest year of school completed(c) |  |  |  |  |  |  |  |
 | Year 9 or below(d) | 35.7 | 37.3 | 36.5 | 1.3 | 1.4 | 1.3 |  |
 | Year 10 or 11 | 17.4 | 20.3 | 19.0 | 1.3 | 1.7 | 1.5 |  |
 | Year 12 or equivalent | 14.5 | 13.7 | 14.1 | 2.0 | 1.8 | 1.9 |  |
|  |
| * estimate has a relative standard error of 25% to 50% and should be used with caution |
| (a) Rate ratios are the age-standardised rates for Indigenous persons divided by the age-standardised rates for non-Indigenous persons. Rates are directly age-standardised to the 2001 Australian population. |
| (b) The equivalised gross household weekly income quintile boundaries are based on the equivalised gross household income per week for the total population of Australia (see Glossary). |
| (c) Excludes persons still at school. |
| (d) Includes persons who never attended school. |
| ABS, 2002 NATSISS and 2002 GSS |
In 2002, Indigenous males and females who were not in the labour force were more likely to report fair or poor health (48% and 32% respectively) than those who were unemployed (20% of males and 25% of females) or employed (15% of males and 14% of females).
Indigenous people who were unemployed were almost twice as likely to report fair or poor health as non-Indigenous people who were unemployed, while Indigenous people who were employed were more than twice as likely to do so (table 7.5).
7.5 Labour force status, Indigenous persons aged 18-64 years - 2002 |
|  |
 | Proportion with fair/poor health | Rate Ratio(a) |  |
 | Males | Females | Persons | Males | Females | Persons |  |
| Labour force status | % | % | % | rate | rate | rate |  |
|  |
| Employed | *14.9 | 14.2 | 14.6 | 2.3 | 2.6 | 2.4 |  |
| Unemployed | 20.4 | 24.6 | 22.2 | 1.5 | 1.9 | 1.7 |  |
| Not in the labour force | 47.5 | 31.7 | 36.7 | 1.2 | 1.6 | 1.4 |  |
|  |
| * estimate has a relative standard error of 25% to 50% and should be used with caution |
| (a) Rate ratios are the age-standardised rates for Indigenous persons divided by the age-standardised rates for non-Indigenous persons. Rates are directly age-standardised to the 2001 Australian population. |
| ABS, 2002 NATSISS |
Self-assessed health status and family and cultural factors
Indigenous males and females who said they had been removed, as children, from their natural families were more likely to report fair or poor health (39% of males and 41% of females) than those who had not been removed (21% of males and 22% of females). Males and females who said they spoke English as their main language at home were more likely to report fair or poor health (24% of males and 25% of females) than those who spoke an Aboriginal or Torres Strait Islander language at home (13% and 15% of males and females respectively; table 7.6).
 Print Page
 Print All