Culture and language
In both 1994 and 2002, just over half of Indigenous people aged 15 years or over reported that they identified with a clan, tribal or language group, while about seven out of ten had attended at least one cultural event in the previous year.
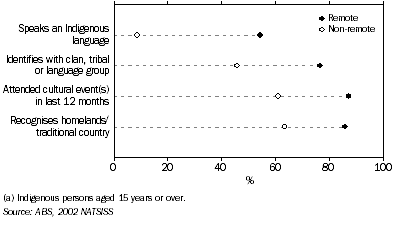
In 2002, 21% of Aboriginal and Torres Strait Islander people aged 15 years or over spoke an Indigenous language. For about one in eight Indigenous people (12%), it was the main language spoken at home, the same as reported in 1994. Indigenous language use was more common among Aboriginal and Torres Strait Islander people living in remote areas, with an Indigenous language being the main language spoken at home for 39% of Indigenous people in remote areas, and for just 2% in non-remote areas. A further 15% of Indigenous people in remote areas, and 7% in non-remote areas, spoke an Indigenous language but for them it was not the main language spoken at home (graph 2.3). More than three-quarters (77%) of Indigenous people living in the Northern Territory spoke an Indigenous language, reflecting the high proportion of Indigenous people living in remote areas.
In 2002, 70% of Indigenous people aged 15 years or over reported that they recognised homelands or traditional country (although they may not necessarily live there) compared with 75% in 1994. In 2002, Indigenous people in remote areas were more likely to recognise an area as their homelands or traditional country (86%) than those in non-remote areas (63%) (graph 2.3).
2.3 Cultural attachment(a), by remoteness - 2002
Family and community life
Participation in community activities
In 2002, 90% of Indigenous people aged 15 years or over reported that they had been involved in social activities in the last three months; nearly half (49%) had participated in sport or physical recreation activities in the last 12 months; and 28% had undertaken voluntary work in the last 12 months. Participation in social activities and sport or physical recreation activities both declined steadily with age while voluntary work peaked among those aged 35-44 years (at 35%) (table 2.4).
2.4 Participation in community activities - 2002 |
|  |
 |  |  | 15-24 years | 25-34 years | 35-44 years | 45-54 years | 55 years or over | Total |  |
|  |
| Males |  |  |  |  |  |  |  |  |
 | Involved in social activities(a) | % | 94.7 | 92.8 | 89.6 | 87.1 | 80.1 | 90.6 |  |
 | Participated in sport or physical recreation activities(b) | % | 75.9 | 63.8 | 49.9 | 37.3 | 28.3 | 57.2 |  |
 | Had undertaken voluntary work(b) | % | 25.7 | 24.2 | 32.4 | 28.3 | 22.1 | 26.6 |  |
| Females |  |  |  |  |  |  |  |  |
 | Involved in social activities(a) | % | 93.4 | 90.5 | 90.0 | 85.5 | 81.3 | 89.5 |  |
 | Participated in sport or physical recreation activities(b) | % | 58.2 | 44.2 | 38.2 | 26.0 | 23.6 | 42.0 |  |
 | Had undertaken voluntary work(b) | % | 24.4 | 25.0 | 37.7 | 29.5 | 28.9 | 28.5 |  |
| Persons |  |  |  |  |  |  |  |  |
 | Involved in social activities(a) | % | 94.1 | 91.6 | 89.8 | 86.2 | 80.8 | 90.0 |  |
 | Participated in sport or physical recreation activities(b) | % | 67.0 | 53.4 | 43.8 | 31.5 | 25.7 | 49.3 |  |
 | Had undertaken voluntary work(b) | % | 25.0 | 24.6 | 35.2 | 28.9 | 25.8 | 27.6 |  |
| Indigenous persons aged 15 years or over | no. | 82 700 | 71 100 | 57 800 | 38 400 | 32 200 | 282 200 |  |
|  |
| (a) In the last 3 months. |
| (b) In the last 12 months. |
| ABS, 2002 NATSISS |
Neighbourhood problems
In 2002, nearly three-quarters (74%) of Indigenous adults reported the presence of neighbourhood or community problems. Those living in major cities were most likely to report problems (80%), with lower levels in regional areas (69%) and remote areas (74%). In major cities over half (52%) of all Indigenous adults reported theft and dangerous or noisy driving as problems in their neighbourhood. These were also the most commonly reported problems in regional areas. For Indigenous people living in remote areas, the most commonly reported problems were alcohol (54%), problems involving youth (48%) and illegal drugs (46%) (table 2.5).
2.5 NEIGHBOURHOOD or COMMUNITY PROBLEMS - 2002 |
|  |
 |  |  | Major cities | Regional | Remote | Total |  |
|  |
| Type of neighbourhood/community problem |  |  |  |  |  |  |
 | Theft | % | 52.0 | 37.4 | 41.5 | 43.0 |  |
 | Problems involving youth | % | 28.7 | 24.8 | 47.9 | 32.3 |  |
 | Prowlers/loiterers(a) | % | 15.8 | 14.2 | . . | . . |  |
 | Vandalism/graffiti/damage to property | % | 37.0 | 23.1 | 43.5 | 32.9 |  |
 | Dangerous or noisy driving(a) | % | 51.7 | 40.9 | . . | . . |  |
 | Alcohol | % | 25.7 | 25.9 | 54.1 | 33.5 |  |
 | Illegal drugs | % | 32.5 | 23.1 | 46.1 | 32.3 |  |
 | Family violence | % | 13.4 | 14.0 | 40.9 | 21.2 |  |
 | Assault | % | 14.1 | 10.2 | 41.1 | 19.9 |  |
 | Sexual assault | % | *5.0 | 4.7 | 16.7 | 8.1 |  |
 | Problems with neighbours(a) | % | 16.3 | 12.2 | . . | . . |  |
 | Levels of neighbourhood conflict | % | 9.4 | 8.5 | 30.8 | 14.9 |  |
 | Level of personal safety day or night(a) | % | 14.0 | 8.4 | . . | . . |  |
| Total reporting at least one neighbourhood/community problem(b) | % | 79.6 | 68.8 | 74.2 | 73.6 |  |
| No neighbourhood/community problems reported | % | 18.9 | 30.3 | 24.9 | 25.3 |  |
| Indigenous persons aged 15 years or over | no. | 86 400 | 118 600 | 77 100 | 282 200 |  |
|  |
| * estimate has a relative standard error of 25% to 50% and should be used with caution |
| . . not applicable |
| (a) Data collected for non-remote areas only. |
| (b) Components do not add to total as people may have provided more than one response. |
| ABS, 2002 NATSISS |
Support in time of crisis
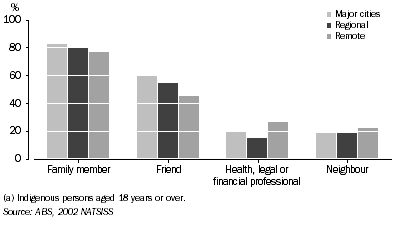
In 2002, the overwhelming majority of both Indigenous (90%) and non-Indigenous (94%) adults aged 18 years or over were able to get support in a time of crisis from someone outside their household. Support could come from family members, friends, neighbours, work colleagues or various community, government or professional organisations and could take the form of emotional, physical or financial help. Availability of support was higher for Indigenous adults living in major cities and regional areas (around 92%) than for those in remote areas (87%). Family members and friends were the most commonly available sources of support for Indigenous people across all geographic remoteness areas (graph 2.6).
2.6 Selected sources of support in time of crisis(a), by remoteness area - 2002
Education
The proportion of Indigenous adults aged 18 years or over who had completed Year 12 increased from 10% in 1994 to 18% in 2002. Over the same period the proportion of Indigenous adults aged 25-64 years with a non-school qualification increased from 20% to 32%. While the increase in non-school qualifications was primarily for those with a certificate or diploma (from 13% to 24%), gains were also recorded in the proportion with a bachelor degree or above (from 1% to 5%).
Despite these gains in educational attainment, Indigenous adults still have lower levels of educational attainment than non-Indigenous adults. In 2002, 18% of Indigenous adults had completed Year 12 compared with 44% of non-Indigenous adults. Similarly, 32% of Indigenous adults aged 25-64 years had a non-school qualification compared with 57% of non-Indigenous adults.
Levels of Indigenous educational attainment declined with increasing geographic remoteness. In 2002, nearly one-quarter (24%) of Indigenous adults living in major cities had completed Year 12 compared with 18% of those living in regional areas and 14% in remote areas. Similarly, among Indigenous adults aged 25-64 years, 41% of those living in major cities had a non-school qualification compared with 32% in regional areas and 23% in remote areas (table 2.7).
2.7 Educational attainment - 1994 and 2002 |
|  |
 |  |  | Indigenous | Non-Indigenous |  |
 |  |  | 1994 | 2002 | 2002 |  |
 |  |  | Total(a) | Major cities | Regional | Remote | Total(a)(b) | Total(b) |  |
|  |
| Highest year of school completed |  |  |  |  |  |  |  |  |
 | Year 12 | % | 9.6 | 23.6 | 17.9 | 13.7 | 18.5 | 43.5 |  |
 | Year 10 or Year 11 | % | 37.0 | 44.3 | 41.6 | 35.3 | 40.7 | 35.5 |  |
 | Year 9 or below(c) | % | 52.5 | 32.0 | 40.5 | 50.9 | 40.8 | 21.0 |  |
| Persons aged 18 years or over who were not still at school | no. | 190 000 | 75 700 | 105 200 | 69 100 | 249 900 | 14 292 100 |  |
| Highest non-school qualification |  |  |  |  |  |  |  |  |
 | Bachelor degree or above | % | 1.2 | 8.4 | 3.5 | 2.1 | 4.6 | 20.6 |  |
 | Certificate III or above(d) | % | 7.9 | 19.3 | 14.5 | 8.8 | 14.4 | 26.3 |  |
 | Certificate I/II | % | 5.3 | 11.5 | 10.0 | 7.7 | 9.8 | 8.5 |  |
 | Total with a non-school qualification(e) | % | 20.2 | 41.5 | 31.5 | 22.7 | 32.1 | 56.9 |  |
| No non-school qualification | % | 79.8 | 58.5 | 68.5 | 77.3 | 67.9 | 43.1 |  |
| Persons aged 25-64 years who were not still at school | no. | 135 600 | 55 500 | 80 400 | 50 600 | 186 400 | 10 258 000 |  |
|  |
| (a) All differences between 1994 and 2002 Indigenous data are statistically significant. |
| (b) Apart from Certificate I/II, differences between 2002 Indigenous and non-Indigenous data are statistically significant. |
| (c) Includes persons who never attended school. |
| (d) Includes persons with a Diploma or Advanced Diploma. |
| (e) Includes level of non-school qualification not determined. |
| ABS, 1994 NATSIS, 2002 NATSISS and 2002 GSS |
Information technology
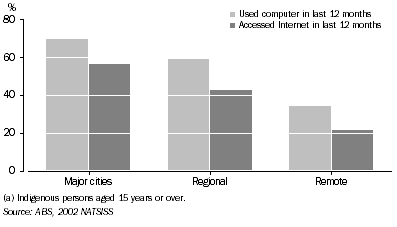
In 2002, 56% of Indigenous people aged 15 years or over reported that they had used a computer in the last 12 months and 41% reported that they had accessed the Internet in the last 12 months. The Internet was most commonly used for personal or private use (17%), followed by education or study (12%) and work or business (11%).
Levels of information technology use were lowest in remote areas. Around one-third of Indigenous people living in remote areas had used a computer, compared with around two-thirds of those living in major cities. Similarly, 22% of Indigenous people in remote areas accessed the Internet compared with 42% of those in regional areas and 56% of those in major cities (graph 2.8).
2.8 Computer and Internet use(a), by remoteness area - 2002
After taking into account the different age structures of the Indigenous and non-Indigenous populations, Indigenous people have lower levels of information technology use than the non-Indigenous population. In 2002, Indigenous people aged 18 years or over were about two-thirds as likely to have used a computer in the last 12 months and half as likely to have accessed the Internet in the last 12 months as non-Indigenous adults.
Work
Between 1994 and 2002 the proportion of Indigenous people aged 18-64 years in mainstream employment (non-CDEP jobs) rose from 31% to 38%. Much of this gain was in part-time employment which increased from 8% to 12%.
In 2002, a further 13% of Indigenous people aged 18-64 years were employed in the CDEP scheme. Most CDEP participants were in remote areas, while in non-remote areas there was a higher proportion of people in mainstream employment.
Indigenous employment levels are strongly associated with educational attainment. In 2002, 69% of those aged 18-64 years who had completed Year 12 were employed, compared with 55% of those who had completed Year 10 or Year 11 and only 39% of those with lower levels of schooling.
Over the same period the proportion of Indigenous people who were unemployed fell from 24% to 13%. This translates to a decline in the unemployment rate from 37% in 1994 to 20% in 2002 and is consistent with the general decline in national unemployment over this period. Long-term unemployment among Indigenous people also fell between 1994 and 2002. In 1994, around half of those who were unemployed had been out of work for a year or more, compared with less than one-third in 2002 (table 2.10).
2.9 Labour force status(a) - 1994 and 2002
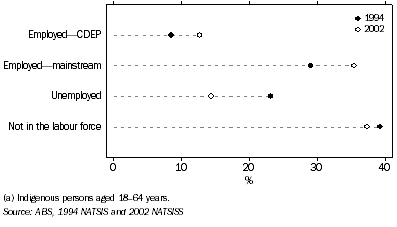
Despite these gains, Indigenous people continue to experience lower levels of labour force participation and employment and higher levels of unemployment than non-Indigenous people. In 2002, 64% of Indigenous adults aged 18-64 years were in the labour force, including 38% in mainstream employment. In comparison, 79% of non-Indigenous adults were in the labour force, including 74% who were employed. Indigenous adults were about two and a half times as likely as non-Indigenous adults to be unemployed (13% compared with 5%).
2.10 LABOUR FORCE STATUS, by Indigenous status - 1994 and 2002 |
|  |
 |  |  |  | Indigenous | Non-Indigenous |  |
 |  |  |  | 1994 | 2002 | 2002 |  |
 |  |  |  | Total(a) | Major cities | Regional | Remote | Total(a)(b) | Total(b) |  |
|  |
| Employed |  |  |  |  |  |  |  |  |
 | CDEP | % | 9.0 | *4.1 | 5.5 | 36.4 | 13.5 | . . |  |
 | Mainstream |  |  |  |  |  |  |  |  |
 |  | Full-time | % | 22.4 | 35.0 | 25.2 | 14.9 | 25.3 | 53.1 |  |
 |  | Part-time | % | 7.7 | 15.4 | 13.9 | 6.8 | 12.4 | 21.2 |  |
 |  | Total(c) | % | 31.1 | 50.4 | 39.0 | 21.8 | 37.8 | 74.4 |  |
 | Total employed | % | 40.1 | 54.5 | 44.5 | 58.2 | 51.3 | 74.4 |  |
| Unemployed |  |  |  |  |  |  |  |  |
 | Less than one year | % | 10.9 | 10.8 | 10.8 | 3.5 | 8.8 | na |  |
 | One year or more | % | 12.4 | 3.3 | 5.0 | 2.2 | 3.7 | na |  |
 | Total unemployed(d) | % | 23.6 | 14.6 | 16.5 | 5.9 | 13.0 | 4.6 |  |
| Not in the labour force | % | 36.3 | 31.0 | 39.0 | 36.0 | 35.7 | 21.1 |  |
| Persons aged 18-64 years | no. | 183 200 | 72 900 | 100 500 | 65 200 | 238 500 | 12 131 600 |  |
| Labour force participation rate | % | 63.7 | 69.0 | 61.0 | 64.0 | 64.3 | 78.9 |  |
| Unemployment rate | % | 37.1 | 21.1 | 27.1 | 9.2 | 20.3 | 5.8 |  |
|  |
| * estimate has a relative standard error of 25% to 50% and should be used with caution |
| . . not applicable |
| na not available |
| (a) Apart from Not in the labour force and Labour force participation rate, differences between 1994 and 2002 Indigenous data are statistically significant. |
| (b) All differences between 2002 Indigenous and non-Indigenous data are statistically significant. |
| (c) Includes people for whom full-time/part-time status was not stated. |
| (d) Includes people for whom length of unemployment was not stated. |
| ABS, 1994 NATSIS, 2002 NATSISS and 2002 GSS |
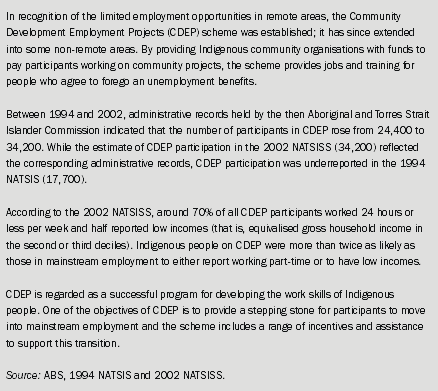
2.11 Community Development Employment Projects (CDEP)
Household income
In 2002, the mean equivalised gross household income of Indigenous people aged 18 years or over was $394 per week, with a higher level reported in major cities ($474 per week) than regional ($362 per week) and remote areas ($354). The real mean equivalised gross household income of Indigenous people between 1994 and 2002 rose from $374 to $394 per week (after adjusting for increases in the cost of living using the Consumer Price Index). Despite this increase, the mean equivalised gross household income of Indigenous adults in 2002 was only 59% of the corresponding income of non-Indigenous adults ($665 per week).
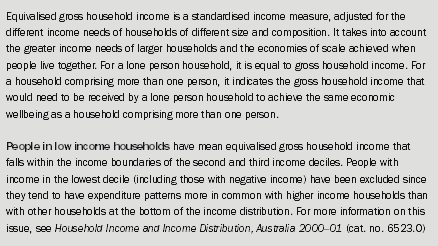
People with low incomes can be defined as those with mean equivalised gross household income in the second and third income deciles (box 2.12). While 20% of non-Indigenous people aged 18 years or over had incomes in the second or third income deciles, 37% of Indigenous people were in this low income group.
2.12 Equivalised gross household income
Financial stress
In 2002, just over one-half (54%) of Indigenous people aged 15 years or over were living in households where the household spokesperson reported that household members would be unable to raise $2,000 within a week in a time of crisis. This measure of financial stress was reported by a greater proportion of people in remote areas (73%) than in regional areas (52%) or major cities (40%) (table 2.13). Overall, Indigenous adults aged 18 years or over were almost four times more likely than non-Indigenous adults to be living in a household that reported this measure of financial stress (54% compared with 14%) (ABS 2004f: table 4).
In the 2002 NATSISS, respondents were asked if anyone in their household had taken actions in the previous 12 months because they needed money for basic living expenses (such as for food, clothing, or to pay bills). Almost half of all Indigenous people aged 15 years or over reported using strategies to deal with their cash flow problems, with similar rates for people living in remote and non-remote areas. The most commonly used strategy, regardless of location, was to seek assistance from friends and family (34% overall). Other commonly reported strategies in major cities and regional areas included seeking assistance from welfare or community organisations and pawning or selling something, while in remote areas, respondents were more likely to report running up a tab at a local store or going without meals (table 2.13).
2.13 Financial stress(a) - 2002 |
|  |
 |  |  | Major cities | Regional | Remote | Total |  |
|  |
| Unable to raise $2000 within a week for something important | % | 40.3 | 52.4 | 73.0 | 54.3 |  |
| Had days without money in last 12 months | % | 44.5 | 44.6 | 41.5 | 43.7 |  |
| Strategies used to meet basic living expenses in last 12 months(b) |  |  |  |  |  |  |
 | Sought assistance from friends or family | % | 35.3 | 32.5 | 35.1 | 34.1 |  |
 | Sought assistance from welfare/community organisations | % | 15.1 | 15.6 | 7.2 | 13.1 |  |
 | Pawned or sold something | % | 16.6 | 12.2 | 2.6 | 10.9 |  |
 | Used short term loans | % | 12.5 | 8.2 | 5.7 | 8.8 |  |
 | Ran up a tab (book up) at a local store | % | 2.6 | 6.5 | 17.0 | 8.2 |  |
 | Did not have meals | % | 6.4 | 6.3 | 9.1 | 7.1 |  |
 | Total reporting at least one strategy(c) | % | 48.5 | 47.9 | 49.6 | 48.5 |  |
| Indigenous persons aged 15 years or over | no. | 86 400 | 118 600 | 77 100 | 282 200 |  |
|  |
| (a) Information provided by a household spokesperson on behalf of household members. |
| (b) Not all strategies are shown. |
| (c) Components do not add to total as people may have provided more than one response. |
| ABS, 2002 NATSISS |
Housing
In 2002, the majority (70%) of Indigenous people aged 18 years or over were living in rented dwellings. The proportion renting was lower in major cities and regional areas (around 64%) than in remote areas (85%). In remote areas, three out of four renters were living in accommodation provided by Indigenous Housing Organisations or in other community housing (table 2.14).
Overall, about one-quarter (27%) of Indigenous people were living in dwellings that were either fully owned or being purchased. The proportion of people in dwellings that were being purchased rose from 11% in 1994 to 17% in 2002.
2.14 TENURE AND LANDLORD TYPE(a), by Indigenous status - 2002 |
|  |
 |  |  | Indigenous | Non-Indigenous |  |
 |  |  | 1994 | 2002 | 2002 |  |
 |  |  | Total(b) | Major cities | Regional | Remote | Total(b)(c) | Total(c) |  |
|  |
| Owner |  |  |  |  |  |  |  |  |
 | Owner without a mortgage | % | 10.9 | 9.9 | 14.1 | 4.0 | 10.0 | 38.5 |  |
 | Owner with a mortgage | % | 10.6 | 24.3 | 18.6 | 4.6 | 16.5 | 34.6 |  |
| Renter |  |  |  |  |  |  |  |  |
 | State or Territory Housing Authority | % | 33.3 | 26.5 | 22.9 | 12.6 | 21.2 | 3.8 |  |
 | Indigenous Housing Organisation/ Community housing | % | 16.5 | *5.0 | 11.7 | 64.2 | 24.2 | 0.4 |  |
 | Private and other renter | % | 21.1 | 31.4 | 29.3 | 8.5 | 24.2 | 20.1 |  |
 | Total renters | % | 71.5 | 63.1 | 64.1 | 85.3 | 69.6 | 24.3 |  |
| Persons aged 18 years or over | no. | 190 800 | 76 000 | 106 000 | 69 300 | 251 400 | 14 353 800 |  |
|  |
| * estimate has a relative standard error of 25% to 50% and should be used with caution |
| (a) Some tenure types are not shown in this table. |
| (b) Apart from Owner without a mortgage and Total renters, differences between 1994 and 2002 Indigenous data are statistically significant. |
| (c) All differences between Indigenous and non-Indigenous data are statistically significant. |
| ABS, 1994 NATSIS, 2002 NATSISS and 2002 GSS |
Access to transport
Overall, Indigenous people are less likely to have access to transport than non-Indigenous people. In 2002, 60% of Indigenous people aged 18 years or over had access to a motor vehicle to drive compared with 85% of non-Indigenous adults. They were also three times more likely (12% compared with 4%) to report that they had a high level of difficulty getting to the places needed (that is they could not get to, or often had difficulty getting to) the places needed.
Indigenous people living in remote areas had more limited access to transport than those in non-remote areas. A lower proportion in remote areas had access to a motor vehicle to drive while a greater proportion reported a high level of difficulty getting to the places where they needed to go. Public transport use was also more limited in remote areas (14%) compared with regional areas (20%) and major cities (45%) (table 2.15). In remote areas, almost three-quarters (73%) of those who did not use public transport reported the lack of an available service as the main reason for not using public transport.
2.15 Access to transport, by Indigenous status - 2002 |
|  |
 |  |  | Indigenous | Non-Indigenous |  |
 |  |  | Major cities | Regional | Remote | Total(a) | Total(a) |  |
|  |
| Difficulty with transport |  |  |  |  |  |  |  |
 | Can easily get to the places needed | % | 77.0 | 71.1 | 65.2 | 71.2 | 84.4 |  |
 | Sometimes have difficulty getting to the places needed | % | 14.8 | 17.5 | 17.7 | 16.7 | 11.8 |  |
 | Often have difficulty getting to the places needed | % | 4.4 | 4.8 | 3.4 | 4.3 | 3.2 |  |
 | Cannot get to the places needed | % | 3.7 | 6.3 | 13.0 | 7.3 | 0.4 |  |
| Has access to motor vehicles to drive | % | 66.6 | 62.8 | 47.5 | 59.7 | 85.2 |  |
| Does not have access to motor vehicles to drive | % | 33.4 | 37.2 | 51.3 | 39.9 | 14.8 |  |
| Used public transport in last 2 weeks | % | 44.8 | 20.3 | 13.8 | 25.9 | . . |  |
| Did not use public tranport in last 2 weeks | % | 55.2 | 79.7 | 86.2 | 74.1 | . . |  |
| Persons aged 18 years or over | no. | 76 000 | 106 000 | 69 300 | 251 400 | 14 353 800 |  |
|  |
| . . not applicable |
| (a) All differences between Indigenous and non-Indigenous data are statistically significant. |
| ABS, 2002 NATSISS and 2002 GSS |
Law and justice
Between 1994 and 2002, the proportion of Indigenous adults aged 18 years or over who reported being a victim of physical or threatened violence in the previous 12 months almost doubled (from 13% to 24%). Different wording of victimisation questions used in the 1994 and 2002 surveys may account in part for the higher level of victimisation in 2002 compared with 1994.
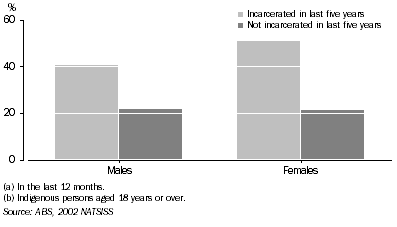
In 2002, higher rates of victimisation were reported among Indigenous adults who had been arrested and/or incarcerated. For example, those who had been incarcerated at some time in the last five years were almost twice as likely to have been a victim of physical or threatened violence in the previous 12 months as those who had not been incarcerated (43% compared with 22%). The association between incarceration and a high level of victimisation was more pronounced for women than men (graph 2.16).
2.16 Rate of victimisation(a)(b), by whether incarcerated - 2002
Based on administrative records held by corrective services agencies in each state and territory, there were 5,048 Indigenous prisoners in Australia at 30 June 2004 (representing 21% of the prisoner population). Of all Indigenous prisoners, 92% were men and 8% women. The crude imprisonment rate for the Indigenous population was 1,852 prisoners per 100,000 population (ABS 2004g).
After adjusting for age differences between the Indigenous and non-Indigenous populations, Indigenous adults were 11 times more likely than non-Indigenous adults to be in prison. Western Australia had the highest age-standardised ratio of Indigenous to non-Indigenous rates of imprisonment, followed by South Australia (table 2.17).
2.17 Imprisonment rates, by states and territories - 30 June 2004 |
|  |
 |  | NSW | Vic. | Qld | SA | WA | Tas. | NT | ACT | Australia |  |
|  |
| Crude rate |  |  |  |  |  |  |  |  |  |  |
 | Indigenous | 2 012.2 | 1 068.8 | 1 572.2 | 1 623.7 | 3 114.4 | 597.2 | 1 589.4 | 1 094.7 | 1 851.9 |  |
 | Non-Indigenous | 149.1 | 89.2 | 138.3 | 91.4 | 134.5 | 109.4 | 153.5 | 103.0 | 124.3 |  |
 | Ratio of crude rates | 13.5 | 12.0 | 11.4 | 17.8 | 23.2 | 5.5 | 10.4 | 10.6 | 14.9 |  |
| Age-standardised rates |  |  |  |  |  |  |  |  |  |  |
 | Indigenous | 1 561.9 | 810.5 | 1 203.5 | 1 218.5 | 2 358.7 | 467.2 | 1 218.7 | 867.8 | 1 416.9 |  |
 | Non-Indigenous | 153.6 | 91.1 | 141.4 | 100.1 | 136.6 | 121.3 | 141.0 | 88.9 | 129.0 |  |
 | Ratio of age-standardised rates | 10.2 | 8.9 | 8.5 | 12.2 | 17.3 | 3.9 | 8.6 | 9.8 | 11.0 |  |
|  |
| ABS 2004g |
Indigenous prisoners tend to be younger than non-Indigenous prisoners, with a median age of 30 years, three years less than the median age for non-Indigenous prisoners. Over one in twenty (6%) of all Indigenous males aged 25-29 years were in prison at 30 June 2004 (compared with 0.5% or about one in two hundred non-Indigenous males aged 25-29 years).
 Print Page
 Print All