OCCUPATION
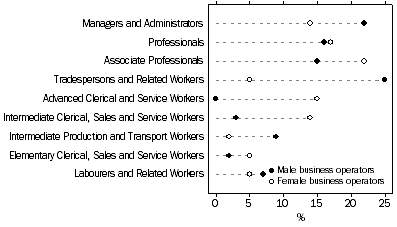
The largest occupational group for business operators was Managers and Administrators 374,000 (20%), followed by Tradespersons and Related Workers 362,000 (19%), Associate Professionals 332,000 (17%) and Professionals 308,000 (16%).
Male and female business operators were distributed quite differently across occupations. The main differences were in Tradespersons and Related Workers (25% of males compared to 5% of females), Managers and Administrators (22% compared to 14%), Advanced Clerical and Service Workers (15% of females compared to less than 1% for males) and Intermediate Clerical, Sales and Service Workers (14% of females compared to 3% males).
Non-business operators (who were working for an employer) were distributed quite differently compared to business operators. There was a higher proportion of business operators classified as Managers and Administrators (20% compared to 6% of non-business operators) as well as Tradespersons and Related Workers (19% compared to 11% non-business operators).
In contrast, there was a higher proportion of non-business operators classified as Intermediate Clerical, Sales and Service Workers (18% compared to 6% of business operators) as well as Elementary Clerical, Sales and Service Workers (11% compared to 3% of business operators).
PROPORTION OF BUSINESS OPERATORS, BY SEX AND OCCUPATION - 2007

 Print Page
 Print All
 Print Page
 Print All