PROJECTED FAMILIES
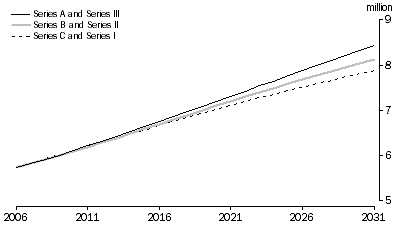
Using the Series B projection as the future population, the number of families in Australia is projected to reach between 8.0 and 8.2 million in 2031. Similarly to the projected number of households, if the Series A population is used instead of Series B, higher numbers of families are projected (between 8.4 and 8.6 million in 2031), while if Series C is used, fewer families are projected (between 7.7 and 7.9 million). Similar results are also apparent for all family types.
5.4 Projected families, Australia, Selected combinations of projection series

5.5 Projected families, Using different population projections |
|
 |  |  | Population projection series(a) |
 |  |  | Series A | Series B | Series C |
| Series and family type(b) | '000 | '000 | '000 |
ESTIMATED FAMILIES, 2006 |
|
| Families |  |  |  |
 | Couple families with children | 2 576.0 | 2 576.0 | 2 576.0 |
 | Couple families without children | 2 134.9 | 2 134.9 | 2 134.9 |
 | One-parent families |  |  |  |
 |  | Male parent | 154.8 | 154.8 | 154.8 |
 |  | Female parent | 766.1 | 766.1 | 766.1 |
 |  | Total | 920.9 | 920.9 | 920.9 |
 | Other families | 103.2 | 103.2 | 103.2 |
 | Total | 5 735.1 | 5 735.1 | 5 735.1 |
PROJECTED FAMILIES, 2031 |
|
| Series I |  |  |  |
 | Couple families with children | 3 570.2 | 3 394.7 | 3 234.7 |
 | Couple families without children | 3 498.4 | 3 346.7 | 3 263.6 |
 | One-parent families |  |  |  |
 |  | Male parent | 232.5 | 221.0 | 213.4 |
 |  | Female parent | 1 131.4 | 1 070.9 | 1 026.8 |
 |  | Total | 1 363.9 | 1 291.9 | 1 240.2 |
 | Other families | 152.8 | 144.0 | 137.2 |
 | Total | 8 585.3 | 8 177.3 | 7 875.7 |
| Series II |  |  |  |
 | Couple families with children | 3 215.7 | 3 057.9 | 2 915.5 |
 | Couple families without children | 3 694.6 | 3 532.2 | 3 444.0 |
 | One-parent families |  |  |  |
 |  | Male parent | 250.3 | 238.0 | 229.8 |
 |  | Female parent | 1 241.3 | 1 174.7 | 1 125.4 |
 |  | Total | 1 491.6 | 1 412.6 | 1 355.2 |
 | Other families | 135.8 | 127.9 | 120.5 |
 | Total | 8 537.6 | 8 130.6 | 7 835.1 |
| Series III |  |  |  |
 | Couple families with children | 2 601.2 | 2 473.9 | 2 361.6 |
 | Couple families without children | 3 966.5 | 3 788.2 | 3 692.4 |
 | One-parent families |  |  |  |
 |  | Male parent | 283.3 | 269.4 | 260.0 |
 |  | Female parent | 1 438.4 | 1 361.3 | 1 302.5 |
 |  | Total | 1 721.7 | 1 630.7 | 1 562.5 |
 | Other families | 147.1 | 138.0 | 129.1 |
 | Total | 8 436.6 | 8 030.7 | 7 745.6 |
|
| (a) Series A, B and C refer to population projections from Population Projections, Australia, 2006 to 2101 (cat. no. 3222.0). |
| (b) Series I, II and III refer to assumptions made about future living arrangements of the population of Australia. See Chapter 2 - Assumptions for more detail. |
 Quality Declaration
  Print Page
 Print All
 Print Page
 Print All