PERSONAL AND COMMERCIAL FINANCE
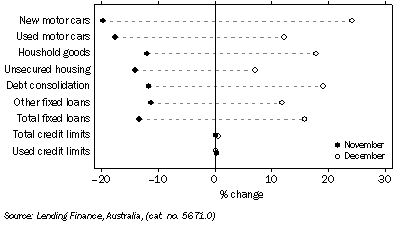
Personal finance commitments, (from Table 8.3) Change from previous month

Personal finance commitments |
|  |
 |  | Fixed loans for - | Revolving credit facilities |  |
 |  | New motor cars and station wagons | New motor cars and station wagons | Used motor cars and station wagons | Used motor cars and station wagons | House- hold and pers- onal goods | Unse- cured loans for owner occup- ation | Debt con- solid- ation and refin- ancing | Other pers- onal | Total | New and increased credit limits during period | Total credit limits at end of period | Credit used at end of period |  |
| Period | no. | $m | no. | $m | $m | $m | $m | $m | $m | $m | $m | $m |  |
Annual |  |
|  |
| 2005-06 | 140 618 | 3 537 | 311 909 | 5 191 | 1 091 | 447 | 10 939 | 12 510 | 33 715 | 41 234 | 2 520 501 | 1 211 255 |  |
| 2006-07 | 147 965 | 3 756 | 293 496 | 5 040 | 1 187 | 494 | 12 061 | 14 391 | 36 929 | 42 917 | 2 715 900 | 1 280 624 |  |
| 2007-08 | 152 956 | 3 988 | 293 629 | 5 290 | 1 192 | 434 | 12 249 | 14 418 | 37 573 | 44 782 | 3 004 875 | 1 337 747 |  |
Percentage change from previous year |  |
|  |
| 2005-06 | -8.3 | -6.3 | -9.6 | -13.4 | 0.9 | -12.0 | 12.8 | -0.3 | 0.8 | 3.9 | 8.3 | 7.0 |  |
| 2006-07 | 6.2 | 5.2 | -2.9 | -5.9 | 8.8 | 10.5 | 10.3 | 15.0 | 9.5 | 4.1 | 7.8 | 5.7 |  |
| 2007-08 | 6.2 | 3.4 | 5.0 | 0.0 | 0.4 | -12.2 | 1.6 | 0.2 | 1.7 | 4.3 | 10.6 | 4.5 |  |
Monthly |  |
|  |
| 2007-2008 |  |  |  |  |  |  |  |  |  |  |  |  |  |
 | October | 13 266 | 345 | 26 591 | 479 | 106 | 41 | 1 023 | 1 315 | 3 309 | 4 166 | 245 384 | 108 922 |  |
 | November | 13 307 | 346 | 25 720 | 462 | 110 | 42 | 1 148 | 1 384 | 3 491 | 3 818 | 247 203 | 109 527 |  |
 | December | 12 182 | 321 | 22 031 | 398 | 92 | 34 | 961 | 1 224 | 3 030 | 3 889 | 248 989 | 110 268 |  |
 | January | 13 426 | 351 | 24 708 | 449 | 101 | 32 | 1 022 | 1 147 | 3 102 | 3 510 | 250 721 | 110 540 |  |
 | February | 14 054 | 361 | 25 255 | 453 | 110 | 38 | 1 213 | 1 175 | 3 349 | 3 637 | 252 396 | 111 500 |  |
 | March | 12 204 | 321 | 22 618 | 411 | 98 | 33 | 1 065 | 1 089 | 3 017 | 3 319 | 254 158 | 111 573 |  |
 | April | 12 419 | 325 | 23 862 | 432 | 103 | 34 | 1 029 | 1 158 | 3 081 | 3 772 | 255 972 | 112 439 |  |
 | May | 12 476 | 323 | 23 941 | 431 | 89 | 37 | 923 | 1 109 | 2 912 | 3 727 | 257 807 | 113 075 |  |
 | June | 13 071 | 340 | 22 532 | 409 | 101 | 34 | 1 090 | 1 240 | 3 213 | 4 082 | 259 879 | 115 233 |  |
| 2008-2009 |  |  |  |  |  |  |  |  |  |  |  |  |  |
 | July | 12 259 | 310 | 23 915 | 427 | 96 | 37 | 968 | 1 149 | 2 987 | 4 073 | 260 967 | 115 084 |  |
 | August | 11 012 | 277 | 22 809 | 402 | 87 | 30 | 828 | 1 012 | 2 637 | 3 199 | 262 513 | 115 345 |  |
 | September | 11 766 | 300 | 23 880 | 427 | 86 | 35 | 871 | 1 013 | 2 733 | 3 547 | 264 514 | 115 860 |  |
 | October | 11 916 | 301 | 23 596 | 417 | 103 | 36 | 962 | 978 | 2 796 | 3 733 | 266 009 | 116 668 |  |
 | November | 9 729 | 242 | 19 277 | 343 | 91 | 31 | 849 | 867 | 2 423 | 3 393 | 266 504 | 117 023 |  |
 | December | 11 710 | 300 | 20 925 | 386 | 107 | 33 | 1 011 | 970 | 2 807 | 3 741 | 268 025 | 117 247 |  |
Percentage change from previous month |  |
|  |
| 2007-2008 |  |  |  |  |  |  |  |  |  |  |  |  |  |
 | April | 1.8 | 1.3 | 5.5 | 5.0 | 5.7 | 2.3 | -3.4 | 6.4 | 2.1 | 13.6 | 0.7 | 0.8 |  |
 | May | 0.5 | -0.6 | 0.3 | -0.2 | -13.6 | 8.5 | -10.3 | -4.2 | -5.5 | -1.2 | 0.7 | 0.6 |  |
 | June | 4.8 | 5.3 | -5.9 | -5.2 | 13.4 | -8.8 | 18.0 | 11.8 | 10.3 | 9.5 | 0.8 | 1.9 |  |
| 2008-2009 |  |  |  |  |  |  |  |  |  |  |  |  |  |
 | July | -6.2 | -8.8 | 6.1 | 4.5 | -5.7 | 9.8 | -11.1 | -7.3 | -7.0 | -0.2 | 0.4 | -0.1 |  |
 | August | -10.2 | -10.6 | -4.6 | -5.8 | -8.7 | -18.5 | -14.5 | -12.0 | -11.7 | -21.5 | 0.6 | 0.2 |  |
 | September | 6.8 | 8.2 | 4.7 | 6.2 | -1.0 | 17.0 | 5.2 | 0.2 | 3.7 | 10.9 | 0.8 | 0.4 |  |
 | October | 1.3 | 0.3 | -1.2 | -2.5 | 18.9 | 3.1 | 10.4 | -3.5 | 2.3 | 5.2 | 0.6 | 0.7 |  |
 | November | -18.4 | -19.7 | -18.3 | -17.6 | -11.9 | -14.0 | -11.7 | -11.3 | -13.3 | -9.1 | 0.2 | 0.3 |  |
 | December | 20.4 | 24.3 | 8.5 | 12.3 | 17.9 | 7.1 | 19.0 | 11.9 | 15.8 | 10.2 | 0.6 | 0.2 |  |
|  |
| Source: Lending Finance, Australia, (cat. no. 5671.0) |
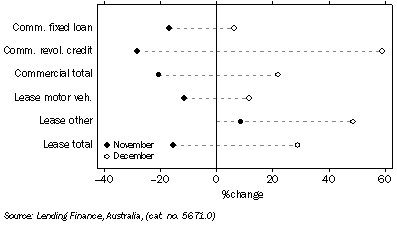
Commercial and lease finance commitments, (from Table 8.4) Change from previous month

Commercial and lease finance commitments |
|  |
 |  | Commercial | Lease |  |
| Period | Fixed loan facilities | Revolving credit facilities | Total | Motor vehicles | Other | Total |  |
Annual ($ million) |  |
|  |
| 2005-06 | 243 597 | 126 524 | 370 122 | 3 102 | 3 747 | 6 848 |  |
| 2006-07 | 277 536 | 177 637 | 455 173 | 2 940 | 3 385 | 6 325 |  |
| 2007-08 | 320 083 | 166 518 | 486 600 | 3 363 | 3 489 | 7 012 |  |
Percentage change from previous year |  |
|  |
| 2005-06 | 22.3 | 14.6 | 19.6 | -0.7 | 17.6 | 8.6 |  |
| 2006-07 | 13.9 | 40.4 | 23.0 | -5.2 | -9.7 | -7.6 |  |
| 2007-08 | 15.3 | -6.3 | 6.9 | 14.4 | 3.1 | 10.9 |  |
Original ($ million) |  |
|  |
| 2007-2008 |  |  |  |  |  |  |  |
 | October | 27 605 | 15 623 | 43 227 | 280 | 336 | 617 |  |
 | November | 30 098 | 19 452 | 49 551 | 304 | 337 | 640 |  |
 | December | 33 195 | 15 108 | 48 303 | 267 | 318 | 585 |  |
 | January | 27 820 | 12 643 | 40 463 | 238 | 277 | 515 |  |
 | February | 27 729 | 13 754 | 41 483 | 272 | 290 | 562 |  |
 | March | 20 302 | 11 901 | 32 203 | 259 | 287 | 546 |  |
 | April | 19 471 | 9 380 | 28 851 | 316 | 241 | 558 |  |
 | May | 23 305 | 11 214 | 34 520 | 306 | 260 | 566 |  |
 | June | 25 791 | 13 595 | 39 386 | 315 | 278 | 754 |  |
| 2008-2009 |  |  |  |  |  |  |  |
 | July | 21 797 | 12 080 | 33 877 | 319 | 261 | 579 |  |
 | August | 17 682 | 11 597 | 29 279 | 267 | 258 | 525 |  |
 | September | 20 496 | 10 763 | 31 258 | 272 | 235 | 507 |  |
 | October | 23 308 | 11 335 | 34 644 | 283 | 200 | 554 |  |
 | November | 19 388 | 8 132 | 27 521 | 251 | 218 | 468 |  |
 | December | 20 607 | 12 933 | 33 540 | 280 | 324 | 604 |  |
Percentage change from previous month |  |
|  |
| 2007-2008 |  |  |  |  |  |  |  |
 | April | -4.1 | -21.2 | -10.4 | 22.1 | -15.9 | 2.1 |  |
 | May | 19.7 | 19.6 | 19.6 | -3.3 | 7.6 | 1.4 |  |
 | June | 10.7 | 21.2 | 14.1 | 3.2 | 6.8 | 33.3 |  |
| 2008-2009 |  |  |  |  |  |  |  |
 | July | -15.5 | -11.1 | -14.0 | 1.0 | -6.0 | -23.2 |  |
 | August | -18.9 | -4.0 | -13.6 | -16.2 | -0.9 | -9.3 |  |
 | September | 15.9 | -7.2 | 6.8 | 1.8 | -9.1 | -3.5 |  |
 | October | 13.7 | 5.3 | 10.8 | 4.2 | -14.7 | 9.2 |  |
 | November | -16.8 | -28.3 | -20.6 | -11.5 | 8.6 | -15.4 |  |
 | December | 6.3 | 59.0 | 21.9 | 11.6 | 48.8 | 28.9 |  |
|  |
| Source: Lending Finance, Australia, (cat. no. 5671.0) |
 Print Page
 Print Page