The following section covers prevalence and hospitalisations for conditions such as circulatory diseases, diabetes, kidney disease, cancer, injury, respiratory diseases, and communicable diseases.
Circulatory system diseases
Circulatory system diseases include coronary heart disease, stroke, peripheral vascular disease, hypertension and heart failure. The main underlying problem in circulatory system disease is atherosclerosis, a process that clogs blood vessels with deposits of fat, cholesterol and other substances that have built up in the inner lining of the vessels. It is most serious when it affects the blood supply to the heart (which can lead to angina, heart attack or sudden death) or to the brain (which can lead to a stroke).
Prevalence of circulatory system diseases
The NHS estimated that in 2001, 11% of Indigenous Australians reported a long-term health condition associated with the circulatory system. The age-standardised prevalence of circulatory system diseases among Indigenous Australians was not significantly different from the prevalence experienced by non-Indigenous Australians (ABS 2002b). The most commonly reported condition of the circulatory system among Indigenous Australians was hypertension. Prevalence of hypertension increased with age for both Indigenous and non-Indigenous Australians. Among people aged 25 years or over, prevalence levels for Aboriginal and Torres Strait Islander people are similar to those experienced by non-Indigenous Australians who are 10 years older.
A disease of the circulatory system that affects mainly Indigenous Australians is rheumatic heart disease. Rheumatic heart disease is caused by the long-term damage done to the heart muscle or heart valves by acute rheumatic fever. Acute rheumatic fever is a delayed complication of a throat or possibly skin infection caused by group A Streptococcus bacterium. Both acute rheumatic fever and rheumatic heart disease are important and preventable causes of ill-health and death. They are typically associated with overcrowding, poor sanitary conditions and other aspects of social and economic disadvantage. Limited access to medical care for adequate diagnosis and ongoing treatment of these diseases for some population subgroups contributes to their occurrence and recurrence (Couzos & Carapetis 2003).
A register of persons with known or suspected rheumatic fever and rheumatic heart disease has operated in the Top End of the Northern Territory since 1997 and in Central Australia since 2002. In 2002 there were 696 people diagnosed with rheumatic heart disease in the Top End of the Northern Territory, 92% of whom were Aboriginal and Torres Strait Islander people (643 cases). About two-thirds (65%) of these cases were Indigenous women. In Central Australia, there was a total of 283 cases of rheumatic heart disease. Of these, 267 cases (94%) were reported for Aboriginal and Torres Strait Islander people. In Central Australia the prevalence rate was around 13 per 1,000 among Indigenous Australians compared with less than one per 1,000 among other Australians (Field 2004).
In 2002, 58 people were diagnosed with acute rheumatic fever in the Top End of the Northern Territory, with a further 27 cases in Central Australia, all of whom were Indigenous Australians. The highest incidence rates were found among Aboriginal and Torres Strait Islander children aged 5-14 years, at 346 per 100,000 in the Top End and 365 per 100,000 in Central Australia.
Hospitalisations for circulatory system diseases
In 2003-04, diseases of the circulatory system were the main reason for 3,845 hospitalisations of Indigenous males and represented 4% of overall hospitalisations of Indigenous males. For Indigenous females, the comparative figures were 3,415 hospitalisations, representing 3% of overall hospitalisations for Indigenous females.
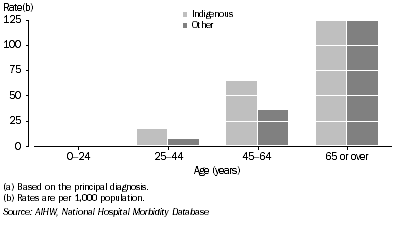
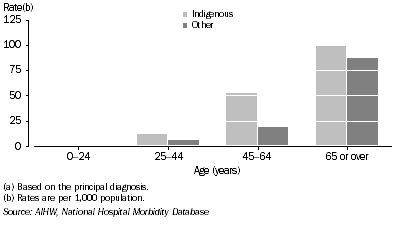
Indigenous Australians had higher hospitalisation rates for diseases of the circulatory system than other Australians across all age groups. The differences were most marked among people aged 45-64 years, where Indigenous male and female hospitalisation rates were 2-3 times the rates for other males and females (graphs 7.11 and 7.12).
7.11 Male rates of hospitalisation for diseases of the circulatory system(a), by Indigenous status - 2003-04
 7.12 Female rates of hospitalisation for diseases of the circulatory system(a), by Indigenous status - 2003-04
Indigenous Australians were hospitalised at higher rates for most types of circulatory system diseases than other Australians (table 7.13). For the most common type of circulatory system disease (ischaemic heart disease), there were approximately twice as many hospitalisations for Indigenous males and almost four times as many hospitalisations for Indigenous females as for other Australian males and females respectively. Hospitalisations for hypertensive disease were also substantially higher in the Indigenous population than among other Australians. Most notably, hospitalisations for rheumatic heart disease were 13 and 16 times higher for Indigenous males and females respectively. These large differences are to some extent determined by the very low numbers of hospitalisations in the non-Indigenous population.
7.13 Hospitalisations for diseases of the circulatory system(a), Indigenous persons - 2003-04 |
|  |
 | Males | Females |  |
 | Observed | Expected | Ratio(b) | Observed | Expected | Ratio(b) |  |
|  |
| Ischaemic heart disease (I20-I25) | 1 876 | 847 | 2.2 | 1 450 | 384 | 3.8 |  |
| Other heart disease (I26-I28, I30-I52) | 1 066 | 543 | 2.0 | 905 | 421 | 2.1 |  |
| Cerebrovascular disease (I60-I69) | 294 | 142 | 2.1 | 278 | 132 | 2.1 |  |
| Hypertensive disease (I10-I15) | 116 | 29 | 4.1 | 186 | 38 | 4.9 |  |
| Rheumatic heart disease (I00-I02, I05-I09) | 103 | 8 | 12.9 | 199 | 12 | 16.2 |  |
| Other diseases of the circulatory system (I70-I99) | 390 | 626 | 0.6 | 397 | 644 | 0.6 |  |
| Total (I00-I99) | 3 845 | 2 194 | 1.8 | 3 415 | 1 633 | 2.1 |  |
|  |
| (a) Based on the principal diagnosis. |
| (b) Ratio is observed hospitalisations divided by expected hospitalisations. Expected hospitalisations are based on the age, sex and cause-specific rates for 'Other' Australians. |
| AIHW, National Hospital Morbidity Database |
Diabetes
Diabetes is a significant health problem for Indigenous Australians. There are three main types of diabetes: Type I, Type II and gestational diabetes. Type I diabetes is caused by a total lack, or near total lack, of insulin, while Type II diabetes is marked by a reduced level of insulin and/or an inability to use insulin properly (i.e. insulin resistance) (AIHW 2002e). Gestational diabetes occurs during pregnancy in about 3% to 8% of all females not previously diagnosed with diabetes and usually disappears after the baby is born (AIHW 2002e).
The majority (an estimated 98-99%) of cases of diabetes among Indigenous Australians are Type II, with only 1-2% being Type I (de Courten et al. 1998). There are limited national data available to accurately measure the extent of gestational diabetes among Indigenous women; however the incidence rate may be as high as 20% (Colagiuri et al. 1998).
Prevalence of diabetes
In 2001, approximately 5% of Indigenous Australians of all ages reported diabetes as a long-term health condition. Indigenous Australians from remote areas were more likely to report having diabetes than those from non-remote areas (7% compared with 5%).
From age 25 years, diabetes was more prevalent among Indigenous Australians than among non-Indigenous Australians. While in both populations prevalence was progressively higher in older age groups, the prevalence among Indigenous Australians aged 35-44 years was almost as high as among non-Indigenous Australians aged 55 years or over.
The age-standardised prevalence of self-reported diabetes among Indigenous Australians was almost four times the prevalence among non-Indigenous Australians (ABS 2002b).
Hospitalisations due to diabetes
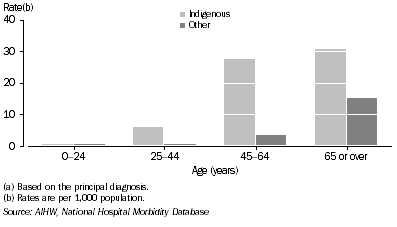
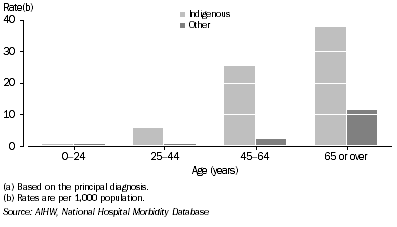
In 2003-04, diabetes was responsible for 3,049 hospitalisations of Indigenous Australians and represented 1% of all Indigenous hospitalisations (of which 49% were for males and 51% were for females). Despite a relatively low population prevalence of Type I diabetes, 17% of hospitalisations for diabetes were for Type I diabetes. Hospitalisation rates for diabetes increased from around 6 per 1,000 population for those aged 25-44 years to 30.6 and 37.7 hospitalisations per 1,000 population for males and females, respectively, aged 65 years or over (graphs 7.14 and 7.15). Among people aged 25 years or over, hospitalisation rates for Indigenous males and females were considerably higher than for other Australian males and females.
After adjusting for differences in age structure, hospitalisation rates for diabetes for Indigenous males and females were five times those for other Australian males and females. Hospitalisation rates for Type II diabetes for Indigenous males and females were eight and ten times those for other Australian males and females.
7.14 Male rates of hospitalisation for diabetes(a), by Indigenous status - 2003-04
 7.15 Female rates of hospitalisation for diabetes(a), by Indigenous status - 2003-04
he data reported here are for diabetes as the principal diagnosis only. However diabetes is more frequently reported as an additional diagnosis (i.e. as a comorbidity) than as the principal diagnosis. In 2003-04, diabetes was recorded as an additional diagnosis for 26,049 hospitalisations of Indigenous Australians (excluding hospitalisations with a principal diagnosis of diabetes). The most common diagnosis for Indigenous Australians with diabetes as an additional diagnosis was care involving dialysis. Diseases of the circulatory and respiratory systems were also common reasons for hospitalisations for which diabetes was an additional diagnosis (AIHW 2002e).
The extent and contribution of diabetes to hospitalisations for other conditions varied. For example, 69% of hospitalisations of Indigenous Australians for other bacterial diseases had diabetes as an additional diagnosis compared with only 17% of hospitalisations of other Australians. Similarly, 44% of hospitalisations of Indigenous Australians for ischaemic heart disease had diabetes as an additional diagnosis while among other Australians the proportion was 21%. Corresponding proportions for hypertensive diseases were 34% for Indigenous Australians and 14% for other Australians (table 7.16).
7.16 Hospitalisations with Diabetes as an additional diagnosis(a) - 2003-04 |
|  |
 | Indigenous(b) | Other(b) |  |
 | % | % |  |
|  |
| Bacterial diseases (A30-A49)(c) | 68.8 | 17.4 |  |
| Metabolic disorders (E70-E89) | 59.8 | 9.4 |  |
| Complications of surgical and medical care n.e.c. (T80-T88) | 56.8 | 11.0 |  |
| Other forms of heart disease (I30-I52) | 49.0 | 17.9 |  |
| Cerebrovascular diseases (I60-I69) | 45.6 | 18.4 |  |
| Ischaemic heart diseases (I20-I25) | 44.3 | 20.8 |  |
| Nutritional anaemias (D50-D53) | 38.1 | 13.0 |  |
| Hypertensive diseases (I10-I15) | 34.1 | 14.0 |  |
|  |
| (a) Excludes hospitalisations with a principal diagnosis of diabetes. |
| (b) Indirectly standardised proportion of hospitalisations for other conditions with diabetes as an additional diagnosis, based on the age and cause-specific rates for 'Other' Australians. |
| (c) Excludes intestinal infectious diseases, tuberculosis and certain zoonotic bacterial diseases. |
| AIHW, National Hospital Morbidity Database |
Kidney disease
The main function of the kidneys is ‘to regulate the water content, mineral composition and acidity of the body’ (Vander et al. 1990). They are also involved in the excretion of metabolic waste products and of various chemicals.
Kidney disease has a marked impact on the quality of life of those who have it as well as those who care for them. It is expensive to treat, and the rates of kidney disease are known to be high in some Indigenous communities (McDonald et al. 2005; Shephard et al. 2003).
The association between kidney disease and other aspects of the health of Indigenous people is extremely important. Diseases and conditions such as diabetes, high blood pressure, infections, low birthweight and obesity are all risk factors for kidney disease (Catford et al. 1997), and are all more common among Indigenous people than among other Australians. Socioeconomic disadvantage has also been shown to be associated with higher rates of renal disease among Indigenous Australians (Cass et al. 2001; Cass et al. 2004). Cass et al. (2004) illustrated a number of pathways linking disadvantage and kidney disease, including psychosocial factors, cultural factors, damaging health behaviours, factors related to the health-care system and government/corporate policies.
The following section presents information from the Australian and New Zealand Dialysis and Transplant Registry (ANZDATA), and from hospitalisation data.
Chronic kidney disease
Chronic kidney disease includes diabetic nephropathy, hypertensive renal disease, glomerular disease, chronic renal failure and end-stage renal disease (ESRD). ESRD results when about 95% of kidney function has been lost (Catford et al. 1997). This is the last and most debilitating stage of chronic kidney disease in which dialysis or kidney transplantation is necessary to maintain life.
Information is available on Indigenous persons with ESRD from the ANZDATA. In Australia, persons who develop ESRD and undertake dialysis or kidney transplantation are registered with ANZDATA. The registry is the most comprehensive and reliable source of information on persons treated for ESRD. It compiles data on incidence and prevalence, renal complications, comorbidities and patient deaths. Indigenous identification in the ANZDATA registry is based on hospital records. However, because of the heightened awareness of the extent of renal disease among Indigenous Australians and the prolonged and repeated contact with renal units in hospitals, it is believed that Indigenous identification in the ANZDATA registry is more complete than in general hospital data (Cass et al. 2001). There is little information, however, on earlier chronic kidney disease, despite its importance in the Indigenous population. The main focus of this section will therefore be on ESRD.
Prevalence and incidence of end-stage renal disease
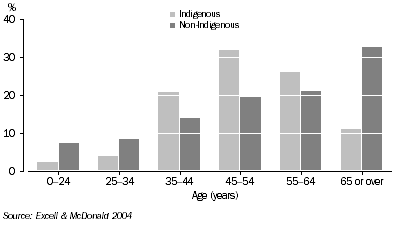
In 2003, 6.5% (882) of the 13,625 persons registered with ANZDATA were identified as Indigenous Australians. This is a much higher proportion than the 2.4% Indigenous representation in the total population. Indigenous people commencing ESRD treatment were substantially younger than non-Indigenous Australians commencing ESRD treatment. About two-thirds (63%) of Aboriginal and Torres Strait Islander people registered with ANZDATA were aged less than 55 years, whereas less than half (46%) of non-Indigenous Australians registered were below that age (graph 7.17).
7.17 End-stage renal disease patients, by Indigenous status - 2003
The numbers of patients starting ESRD treatment have more than doubled in the last 10 years, with the rate for Indigenous people increasing faster than the rate for non-Indigenous patients (Russ 2002). The incidence rate of dialysis among Indigenous people increased from 17 per 100,000 in 1992 to 35 per 100,000 in 2003 (table 7.18). In 2003, 1,953 new dialysis patients were registered in Australia, of whom 168 (8.6%) were identified as being of Aboriginal or Torres Strait Islander origin.
7.18 New dialysis patients, by Indigenous status - 1992-2003 |
|  |
 | Total | Indigenous |  |
 | Number | Number | Proportion of total | Incidence rate(a) |  |
 | no. | no. | % | rate |  |
|  |
| 1992 | 1 086 | 64 | 5.9 | 17.0 |  |
| 1993 | 1 159 | 91 | 7.9 | 23.6 |  |
| 1994 | 1 314 | 111 | 8.4 | 28.1 |  |
| 1995 | 1 383 | 126 | 9.1 | 31.1 |  |
| 1996 | 1 405 | 100 | 7.1 | 24.1 |  |
| 1997 | 1 484 | 152 | 10.2 | 35.9 |  |
| 1998 | 1 609 | 137 | 8.5 | 31.7 |  |
| 1999 | 1 745 | 157 | 9.0 | 35.6 |  |
| 2000 | 1 755 | 150 | 8.5 | 33.3 |  |
| 2001 | 1 911 | 175 | 9.2 | 38.2 |  |
| 2002 | 1 898 | 171 | 9.0 | 36.6 |  |
| 2003 | 1 953 | 168 | 8.6 | 35.3 |  |
|  |
| (a) New dialysis patients per 100,000 population |
| Excell & McDonald 2004 |
In all states and territories, Indigenous Australians accounted for a disproportionate number of new cases. Indigenous patients accounted for 85% of all newly registered dialysis patients in the Northern Territory, 20% in Western Australia and 12% in Queensland. In remote regions, standardised ESRD incidence among Indigenous Australians has been shown to be up to 30 times the national incidence for all Australians, with the variation in incidence strongly associated with markers of socioeconomic disadvantage (Cass et al. 2001). In addition to this higher incidence, patients living in remote areas have reduced access to treatment.
Comorbidities and risk factors for End-Stage Renal Disease
A number of health conditions are associated with renal disease including cerebrovascular disease, lung disease, peripheral vascular disease, coronary artery disease, smoking and diabetes. In 2003, most of these conditions were reported in similar proportions for Aboriginal and Torres Strait Islander and non-Indigenous patients beginning ESRD treatment. Diabetes however was much more likely to be reported for Aboriginal and Torres Strait Islander patients than for non-Indigenous patients (70% and 27% respectively). The greater excess of diabetes among ESRD Indigenous entrants reflects the burden of this disease in the Aboriginal and Torres Strait Islander population. In 2003, diabetes was attributed as the primary cause of ESRD for more than 55% of Indigenous dialysis patients compared with 18% of non-Indigenous dialysis patients (Excell & McDonald 2004).
A number of other factors have been associated with renal disease, including low birthweight, reduced renal volume in childhood, occurrence of childhood post streptococcal glomerulonephritis, obesity, alcohol use, repeated bacterial infections and hypertension. These have all been implicated as factors contributing to the higher incidence rates of ESRD among Indigenous Australians (McDonald & Russ 2003).
Management of kidney disease
ESRD patients require either a kidney transplant or dialysis to maintain the functions normally performed by the kidneys. Patterns of treatment for ESRD differ between Indigenous and non-Indigenous patients. This may be affected by the extent and pattern of comorbidities in the two populations. In 2003, of all Indigenous ESRD patients registered, 86% were reliant on dialysis and only 14% had received a kidney transplant. In comparison, around half (54%) of non-Indigenous Australians living with ESRD were reliant on dialysis and 46% had received a kidney transplant (table 7.19).
Once dialysis treatment has commenced, Indigenous people are less likely to be placed on the active transplant waiting list and less likely to move from the waiting list to transplantation (Cass et al. 2003; McDonald & Russ 2003). Factors which may contribute to these disparities include miscommunication between Indigenous patients and health professionals, a lack of understanding on the part of Indigenous patients about their illness and its treatments, and lower rates of well-matched kidney donors for Indigenous patients than for non-Indigenous patients (Cass et al. 2003; McDonald & Russ 2003).
7.19 End-stage renal disease patients, by treatment type - 1999-2003 |
|  |
 |  | 1999 | 2000 | 2001 | 2002 | 2003 |  |
Indigenous patients |  |
|  |
| Dialysis | % | 81.9 | 82.9 | 84.3 | 85.5 | 86.4 |  |
| Functioning transplant(a) | % | 18.1 | 17.1 | 15.7 | 14.5 | 13.6 |  |
| Total | % | 100.0 | 100.0 | 100.0 | 100.0 | 100.0 |  |
| Total | no. | 648 | 697 | 763 | 829 | 882 |  |
Non-Indigenous patients |  |
|  |
| Dialysis | % | 52.6 | 53.1 | 53.7 | 53.8 | 54.2 |  |
| Functioning transplant(a) | % | 47.4 | 46.9 | 46.3 | 46.2 | 45.8 |  |
| Total | % | 100.0 | 100.0 | 100.0 | 100.0 | 100.0 |  |
| Total | no. | 10 440 | 10 977 | 11 556 | 12 177 | 12 763 |  |
|  |
| (a) Data includes patients who underwent transplants in New Zealand but were resident in Australia and patients who underwent transplants in Australia but were resident in New Zealand. |
| Excell & McDonald 2004 |
In 2003-04, there were around 83,000 hospitalisations of Indigenous Australians for chronic kidney disease and its sequelae, 43% of which were hospitalisations of Indigenous males and 57% of which were hospitalisations of Indigenous females. There were nearly nine times as many hospitalisations for Indigenous males and 16 times as many hospitalisations for Indigenous females as for other Australian males and females respectively. The greatest difference between observed and expected hospitalisations for Indigenous males and females were for diabetic nephropathy (11 and 24 times as high) and for care involving dialysis (9 and 17 times as high). Of all hospitalisations for chronic kidney disease and its sequelae, the majority (81,983 or 98%) were for care involving dialysis (table 7.20).
7.20 Hospitalisations for chronic kidney disease and its sequelae(a), Indigenous persons - 2003-04 |
|  |
 | Males | Females |  |
 | Observed | Expected | Ratio(b) | Observed | Expected | Ratio(b) |  |
|  |
| Chronic renal failure (N18-N19) | 187 | 33 | 5.7 | 172 | 23 | 7.4 |  |
| Diabetic nephropathy (E102, E112, E132, E142) | 173 | 16 | 11.1 | 293 | 12 | 23.8 |  |
| Renal tubulo-interstitial diseases (N11-N12, N14-N16) | 43 | 18 | 2.5 | 348 | 118 | 3.0 |  |
| Glomerular diseases (N00-N08) | 68 | 29 | 2.3 | 70 | 30 | 2.3 |  |
| Hypertensive renal disease (I12-I13, I150-I151) | 5 | 4 | 1.3 | 8 | 3 | 2.9 |  |
| Other chronic kidney disease (N25-N28, N391-N392, Q60-Q63, T824, T861, Z940) | 55 | 43 | 1.3 | 69 | 36 | 1.9 |  |
| Care involving dialysis (Z49) | 35 560 | 4 015 | 8.9 | 46 423 | 2 731 | 17.0 |  |
| Total | 36 091 | 4 157 | 8.7 | 47 383 | 2 954 | 16.0 |  |
|  |
| (a) Based on the principal diagnosis. |
| (b) Ratio is observed hospitalisations divided by expected hospitalisations. Expected hospitalisations are based on the age, sex and cause-specific rates for 'Other' Australians. |
| AIHW, National Hospital Morbidity Database |
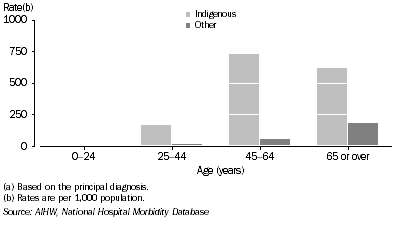
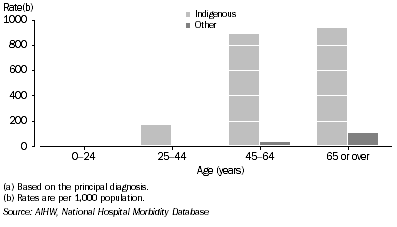
Hospitalisation rates for care involving dialysis were markedly higher in older age groups, peaking for males aged 45-64 years and for females aged 65 years or over (graphs 7.21 and 7.22). In contrast, the rates for other Australians peaked at 65 years or over for both males and females, and at much lower levels. It should be noted that the rates of dialysis are the outcome of some individuals accessing services many times, for example an individual reliant on treatment may undergo dialysis 2 or 3 times a week.
7.21 Male rates of hospitalisation for care involving dialysis(a), by Indigenous status - 2003-04
 7.22 Female rates of hospitalisation for care involving dialysis(a), by Indigenous status - 2003-04
In 2003-04, the overall Indigenous male and female hospitalisation rates for care involving dialysis were 1.2 and 1.3 times higher than in 2000-01.
Cancer
Cancer includes a range of diseases in which abnormal cells proliferate and spread out of control. Normally, cells grow and multiply in an orderly way to form organs that have a specific function in the body. Occasionally, however, cells multiply in an uncontrolled way after being affected by a carcinogen, or after developing a random genetic mutation. They may form a mass which is called a tumour or neoplasm. Tumours can be benign (not a cancer) or malignant (a cancer). Benign tumours do not invade other tissues or spread to other parts of the body, although they can expand to interfere with healthy structures.
For many cancers, the causes are unknown. Some cancers occur as a direct result of smoking (in particular lung cancer), dietary influences (especially cancers of the digestive system), infectious agents (especially cervical cancer through exposure to the human papilloma virus) or exposure to radiation (especially melanomas through excessive sun exposure), while others may be a result of inherited genes (for example, prostate and breast cancer are more common among people with a family history of these cancers). However, the greatest risk factor for most cancers in the general population is advancing age, with the median age of first diagnosis for all cancers being 69 years for men and 65 years for women.
The risk of death due to particular cancers may be reduced through monitoring of individuals at high risk, reducing external risk factors, detecting and treating cancers early in their development, and treating them in accordance with the best available clinical evidence.
Information on cancer presented here comes from state and territory cancer registries, and cancer screening, hospitalisation and mortality data.
Incidence of cancer
Ascertainment of cancer cases is almost complete for all state and territory cancer registries, but Indigenous identification (the identification of Indigenous people among the registered cancer cases) is not complete for any cancer registry. The South Australian and Northern Territory registries have undertaken specific projects to identify all Indigenous cases in their registers, but only the Northern Territory registry has reported the completeness of Indigenous identification; after attempting to identify all Indigenous cases, it was estimated that approximately 18% of Indigenous cases remained incorrectly recorded as non-Indigenous. Incidence rates will therefore underestimate the actual cancer incidence in the Northern Territory's Indigenous population by approximately 18%. Identification of Indigenous cases is also believed to be reasonably complete in the Western Australian and Queensland registries, but this has not been formally assessed.
In the Northern Territory, which has the highest levels of ascertainment (proportion of all cases notified to the cancer registry), the average annual number of new cases of cancer per 100,000 people for 1997-2001 was 445 for Indigenous males, compared with 518 for other males. Indigenous females had almost the same incidence rate as other females (365 compared with 369 per 100,000 per year) (table 7.23). Incidence rates for Indigenous males and females are lower than for other males and females in Queensland, Western Australia and South Australia; however, the level of Indigenous under-identification is not known.
7.23 Incidence of Cancer, by Indigenous status - 1997-2001 |
|  |
 |  | Males | Females |  |
| State/territory(b) | New cases | Average annual rate(a) | New cases | Average annual rate(a) |  |
|  |
| Queensland |  |  |  |  |  |
 | Indigenous | 407 | 453.7 | 447 | 370.1 |  |
 | Other(c) | 43 114 | 576.5 | 35 624 | 420.3 |  |
| South Australia |  |  |  |  |  |
 | Indigenous | 49 | 238.9 | 54 | 213.7 |  |
 | Other(c) | 20 126 | 553.4 | 16 899 | 394.6 |  |
| Western Australia |  |  |  |  |  |
 | Indigenous | 168 | 296.0 | 173 | 261.4 |  |
 | Other(c) | 19 024 | 513.0 | 16 110 | 371.4 |  |
| Northern Territory |  |  |  |  |  |
 | Indigenous | 207 | 445.4 | 216 | 365.1 |  |
 | Other(c) | 998 | 517.8 | 665 | 369.0 |  |
| Australia(d) | 47 820 | 541.4 | 40 578 | 393.3 |  |
|  |
| (a) Rate per 100,000 persons. Directly age-standardised to the 2001 Australian population. |
| (b) State of usual residence. |
| (c) Includes people for whom Indigenous status was not known. |
| (d) All new cases of cancer in Australia in 2001. |
| AIHW, National Cancer Statistics Clearning House |
The most common cancer in Aboriginal and Torres Strait Islander people is lung cancer. Lung cancer has a low five-year survival rate compared with other cancers, at 11% for males and 14% for females, in the general population in 1992-97 (AIHW & AACR 2001). For Aboriginal and Torres Strait Islander males, it was the most frequently diagnosed new cancer from 1997-2001, followed by prostate cancer, colorectal cancer, cancer of unknown primary site and liver cancer. For females, breast cancer was the most frequently occurring new cancer, followed by lung cancer, cervical cancer, colorectal cancer and cancer of the uterus. The lung cancer incidence rate for males was almost twice the rate for females (table 7.24).
In the Northern Territory and South Australia the incidence rates for cancers of the lung, liver, and cervix were higher for Aboriginal and Torres Strait Islander people than for non-Indigenous Australians (Condon et al. 2003). For cancers of the breast, prostate, lymphoma, colon and rectum, and melanoma of the skin, the incidence rates for Indigenous Australians were lower than for non-Indigenous Australians.
Cancer survival
An analysis by the Northern Territory Cancer Registry of five-year relative survival for Northern Territory Indigenous people diagnosed with cancer between 1991 and 1999 found lower survival rates for Indigenous Australians than for other Australians for almost all of the most common cancers (Condon 2004). The differences were statistically significant for cancer of the thyroid, breast, cervix and bowel, and large and close to statistical significance for prostate cancer and leukaemia. Examples of the five-year survival differences were:
- thyroid cancer: 60% for Northern Territory Indigenous people, compared with over 90% for all Australian cases
- female breast cancer: 42% for Northern Territory Indigenous people, compared with over 80% for all Australian cases.
Condon et al. (2004a) concluded that cancer is an important and increasing health problem for Indigenous Australians, and that the cancers affecting Indigenous Australians are largely preventable, through smoking cessation for lung cancer, Pap smear screening for cervical cancer, and hepatitis B vaccination for liver cancer. Indigenous women might also achieve the high breast cancer survival rates experienced in the general female population if they had earlier detection and improved access to effective treatment.
Data on participation by Indigenous women in the BreastScreen Australia screening program are collected by the state programs and published by the AIHW in the annual Breastscreen Australia monitoring report. In the BreastScreen Australia Program in 2001-02 there were 11,542 women aged 40 years or over who identified themselves as Indigenous. Participation in the program by women in the 50-69 years target age group was estimated at 35%, much lower than the 57% participation for the total Australian female population in this age group (AIHW 2005c).
An outcome of this is that a higher proportion of Northern Territory Indigenous women than non-Indigenous women are diagnosed with advanced breast cancer. A higher proportion were also diagnosed in 1991-2000 with advanced disease for cancer of the bowel, cervix and lymphoma, but not for cancer of the lung. Indigenous people also have lower survival at every stage at diagnosis for each of these cancers (Condon et al. 2005).
Cancer risk factors
Several factors may at least partly explain differences between cancer incidence and mortality rates for the Indigenous and non-Indigenous populations. These factors include very high prevalence of tobacco smoking and hepatitis B carriage, low Pap test rates, early onset of child bearing, high numbers of pregnancies and births, and a different diet from other Australians (Condon et al. 2003).
In 2001, approximately 54% of Indigenous adults smoked tobacco. After adjusting for the different age structures in the Indigenous and non-Indigenous populations, the proportion of Indigenous Australians who were current smokers was more than double the proportion in the non-Indigenous population (ABS, 2002b); this contributes to high incidence and mortality rates for smoking-related cancers. For liver cancer, the major risk factor for Indigenous people is chronic hepatitis B infection, which may be exacerbated by excessive alcohol consumption. For cervical cancer, data on Indigenous participation in cervical screening is patchy but suggests that participation is relatively low in at least some areas, in part due to cultural barriers and a lack of female doctors.
The lower incidence of breast cancer among Indigenous Australians than among other Australians can be partially explained by the early average age of first childbirth, high number of pregnancies and possibly longer duration of breastfeeding, all of which have protective effects for breast cancer. The high level of melanin pigmentation in the skin of many Indigenous people is a protective factor against melanoma of the skin and may explain the lower incidence of this cancer in Indigenous people (Condon 2004).
Hospitalisations for cancers
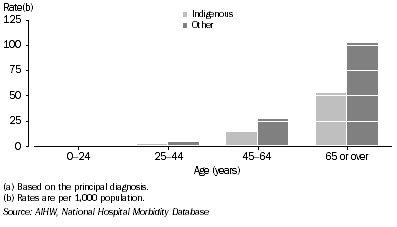
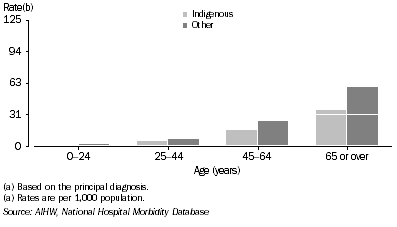
In 2003-04, cancer was responsible for 1,070 hospitalisations of Indigenous males and 1,344 hospitalisations of Indigenous females, 1.1% of both Indigenous male and female hospitalisations. Hospitalisation rates for cancer for both Indigenous and other Australian patients were higher for people aged 25 years or over but were considerably lower for Indigenous than for other Australians in each age group (graphs 7.25 and 7.26).
7.25 Male rates of hospitalisation for cancer(a), by Indigenous status - 2003-04
 7.26 Female rates of hospitalisation for cancer(a), by Indigenous status - 2003-04
Injury and poisoning
Injury and poisoning are large contributors to morbidity, especially in the first half of the life span (AIHW 2004b). A variety of factors affect a person’s risk of being injured, including age, sex, alcohol use and socioeconomic status. The effects of injury on one’s health can be looked at through the damage sustained to the body (e.g. broken bones, head injuries), or through the external cause of the injury (e.g. falls, poisoning and drowning), both of which are recorded by hospitals.
Hospitalisations due to injury or poisoning
In 2003-04, injury or poisoning was the principal diagnosis recorded in over 17,000 hospitalisations of Indigenous patients (table 7.27). Over half (56%) of these hospital episodes were for Indigenous males. Hospitalisations due to injury or poisoning represented 10% of all hospitalisations for Indigenous males and 6% for Indigenous females. The hospitalisation rate for injury and poisoning for Indigenous males and females was around twice that for non-Indigenous Australian males and females.
7.27 Hospitalisations for injury and poisoning(a), Indigenous persons - 2003-04 |
|  |
 | Males | Females |  |
 | Observed | Expected | Ratio(b) | Observed | Expected | Ratio(b) |  |
|  |
| Injuries (S00-T19) | 7 615 | 4 663 | 1.6 | 5 439 | 2 221 | 2.4 |  |
| Complications of surgical and medical care, n.e.c. (T80-T88) | 819 | 491 | 1.7 | 904 | 506 | 1.8 |  |
| Poisoning (T36-T50) | 396 | 267 | 1.5 | 723 | 465 | 1.6 |  |
| Other effects of external causes, early complications of trauma (T66-T79 and T89) | 297 | 113 | 2.6 | 282 | 82 | 3.5 |  |
| Burns and frostbite (T20-T35) | 278 | 139 | 2.0 | 177 | 67 | 2.6 |  |
| Toxic effects (T51-T65) | 227 | 107 | 2.1 | 160 | 70 | 2.3 |  |
| Total(c) | 9 633 | 5 780 | 1.7 | 7 685 | 3 410 | 2.3 |  |
|  |
| (a) Based on the principal diagnosis. |
| (b) Ratios is observed hospitalisations divided by expected hospitalisations. Expected hospitalisations are based on the age, sex and cause-specific rates for 'Other' Australians. |
| (c) Includes sequelae of injuries, poisoning, external causes. |
| AIHW, National Hospital Morbidity Database |
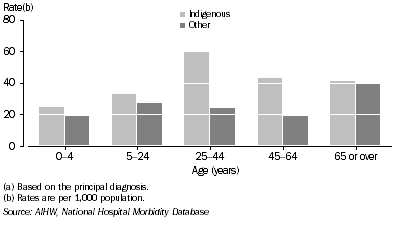
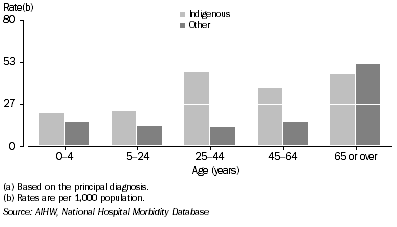
Rates of hospitalisation due to injury or poisoning varied with age (graphs 7.28 and 7.29). For Indigenous people, rates were highest among those aged 25-44 years, while for other Australians, rates were highest among those aged 65 years or over. Indigenous males less than 65 years of age were more likely to be hospitalised for injury and poisoning than were Indigenous females.
7.28 Male rates of hospitalisation for injury or poisoning(a), by Indigenous status - 2003-04
 7.29 Female rates of hospitalisation for injury or poisoning(a), by Indigenous status - 2003-04
External causes of injury resulting in hospitalisation
In 2003-04, as in previous years, the most commonly recorded external causes for injury resulting in hospitalisation were assault (females 28%; males 20%), accidental falls (males 18%; females 16%), transport-related injuries (males 11%; females 7%), and complications of medical or surgical care (females 9%; males 7%).
Indigenous males and females were hospitalised more often than other Australians for most external causes of injury (table 7.30). Hospitalisations recorded for injury due to assault were seven and 31 times higher for Indigenous males and females respectively.
7.30 Hospitalisations for external causes of injury and poisoning(a), Indigenous persons - 2003-04 |
|  |
 | Males | Females |  |
 | Observed | Expected | Ratio(b) | Observed | Expected | Ratio(b) |  |
|  |
| Assault (X85-Y09)(c) | 1 954 | 292 | 6.7 | 2 173 | 71 | 30.8 |  |
| Accidental falls (W00-W19) | 1 699 | 1 320 | 1.3 | 1 203 | 956 | 1.3 |  |
| Exposure to inanimate mechanical forces (W20-W49) | 1 422 | 1 048 | 1.4 | 661 | 353 | 1.9 |  |
| Transport accidents (V01-V99) | 1 044 | 979 | 1.1 | 531 | 420 | 1.3 |  |
| Complications of medical and surgical care (Y40-Y84) | 674 | 452 | 1.5 | 707 | 471 | 1.5 |  |
| Other accidental exposures (X50-X59) | 747 | 713 | 1.0 | 397 | 305 | 1.3 |  |
| Intentional self-harm (X60-X84) | 475 | 198 | 2.4 | 681 | 368 | 1.9 |  |
| Exposure to animate mechanical forces (W50-W64) | 410 | 253 | 1.6 | 188 | 95 | 2.0 |  |
| Exposure to electric current/smoke/fire/animals/nature (W85-X39) | 403 | 199 | 2.0 | 260 | 102 | 2.6 |  |
| Accidental poisoning (X40-X49) | 240 | 153 | 1.6 | 244 | 143 | 1.7 |  |
| Other external causes | 150 | 63 | 2.4 | 128 | 59 | 2.2 |  |
| Total(d) | 9 633 | 5 780 | 1.7 | 7 685 | 3 410 | 2.3 |  |
|  |
| (a) Based on the principal diagnosis. |
| (b) Ratio is the observed hospitalisations divided by expected hospitalisations. Expected hospitalisations are based on the age, sex and cause-specific rates for 'Other' Australians. |
| (c) These data should be interpreted with caution as injuries purposely inflicted by others may be under-reported. |
| (d) Includes injuries where no external cause was reported. |
| AIHW, National Hospital Morbidity Database |
Respiratory diseases
Respiratory diseases are leading causes of illness, disability and mortality. Common respiratory diseases include asthma, chronic obstructive pulmonary disease (COPD) (comprising both chronic bronchitis and emphysema), influenza and pneumonia. While all these respiratory diseases are leading causes of illness resulting in a high use of health services, pneumonia and COPD are leading causes of death.
Prevalence of respiratory diseases
According to the 2001 NHS, 29% of Aboriginal and Torres Strait Islander people reported having a respiratory disease. Among these, 17% reported having asthma. The age standardised prevalence of a long-term condition associated with the respiratory system was similar for Indigenous Australians (33%) and non-Indigenous Australians (30%) (ABS 2002b). However, after adjusting for age, Indigenous Australians were almost one and a half times more likely to have asthma than non-Indigenous Australians. The higher prevalence of asthma in Indigenous Australians occurred across all age groups.
Hospitalisations for respiratory diseases
About 16,000 hospitalisations of Indigenous people for respiratory diseases occurred in 2003-04, representing about 7% of all Indigenous hospitalisations. Hospitalisations for respiratory diseases were about twice as high in the Indigenous population as among other Australians.
For both Indigenous people and other Australians, hospitalisations for respiratory disease are most common among the very young and the old (graphs 7.31 and 7.32). In 2003-04 the hospitalisation rates for respiratory diseases among Indigenous children aged 0-4 years were twice the rate for other Australian children. Almost half of hospitalisations among children aged 0-4 years were for infants (aged less than one year). Hospitalisation rates for Indigenous infants were about three times the rates for other Australian infants. For Indigenous males and females, hospitalisation rates were higher from 25 years of age, while for other Australians higher rates did not occur until around 55 years of age.
7.31 Male rates of hospitalisation for diseases of the respiratory system(a), by Indigenous status - 2003-04
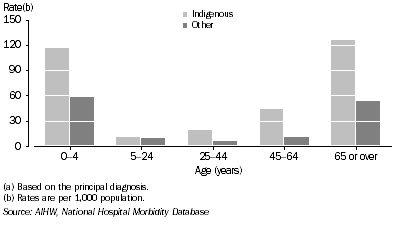 7.32 Female rates of hospitalisation for diseases of the respiratory system(a), by Indigenous status - 2003-04
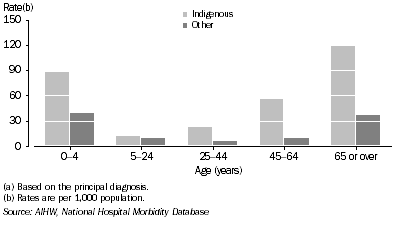
Indigenous Australians were hospitalised at higher rates for most types of respiratory system diseases than other Australians (table 7.33). In 2003-04, hospitalisations of Indigenous males and females for influenza and pneumonia (combined) were around four times as high, for COPD around five to seven times as high and for asthma up to two times as high the rates for other Australians.
7.33 Hospitalisations for diseases of the respiratory system(a), Indigenous persons - 2003-04 |
|  |
 | Males | Females |  |
 | Observed | Expected | Ratio(b) | Observed | Expected | Ratio(b) |  |
|  |
| Influenza and pneumonia (J10-J18) | 2 298 | 575 | 4.0 | 2 115 | 503 | 4.2 |  |
| Other acute lower respiratory infections (J20-J22) | 1 910 | 493 | 3.9 | 1 700 | 373 | 4.6 |  |
| Acute upper respiratory infections (J00-J06) | 1 078 | 686 | 1.6 | 970 | 522 | 1.9 |  |
| Asthma (J45-J46) | 863 | 692 | 1.2 | 1 169 | 552 | 2.1 |  |
| Chronic obstructive pulmonary disease (J41-J44) | 859 | 167 | 5.1 | 1 111 | 151 | 7.4 |  |
| All other respiratory diseases | 997 | 1 306 | 0.8 | 970 | 1 193 | 0.8 |  |
| Total | 8 005 | 3 919 | 2.0 | 8 035 | 3 293 | 2.4 |  |
|  |
| (a) Based on the principal diagnosis. |
| (b) Ratio is observed hospitalisations divided by expected hospitalisations. Expected hospitalisations are based on the age, sex and cause-specific rates for 'Other' Australians. |
| AIHW, National Hospital Mobidity Database |
Immunisation
Communicable respiratory illnesses are a major cause of illness in Aboriginal and Torres Strait Islander people. A serious complication of these illnesses is pneumonia, especially in persons with pre-existing heart or lung disease (NHMRC 2000b). The National Indigenous Pneumococcal and Influenza Immunisation Program provides free vaccines to Indigenous people to protect them from communicable respiratory illnesses, pneumococcal disease and influenza.
A recent report from the National Centre for Immunisation Research and Surveillance of Vaccine Preventable Diseases (NCIRS) showed that there are gaps in vaccination coverage for Indigenous adults. Nevertheless, among adults aged 50-64 years, vaccination coverage was higher for Indigenous Australians than for other Australians (47% compared with 26% for influenza vaccine and 20% compared with 3% for pneumococcal vaccine) (Menzies, McIntyre & Beard 2004). Indigenous adults in remote areas had higher vaccination coverage rates than in non-remote areas for both of these vaccines. Coverage levels for influenza and pneumococcal vaccinations are likely to be higher for Indigenous adults than other adults as these vaccines have been funded for Indigenous people since 1999.
For information on childhood vaccination rates, refer to Chapter 6.
Communicable diseases including HIV/AIDS
While much of the burden of communicable diseases comes from respiratory infections such as influenza and pneumonia, data presented here include notification and hospitalisation as the result of other serious communicable diseases such as sexually transmissible infections (STIs), viral hepatitis and viral infections such as mumps, measles and rubella. The evidence from these analyses reinforces the fact that the burden of communicable diseases for Indigenous Australians is far greater than for other Australians.
Notifications
In Australia, communicable diseases of particular health importance are notifiable and under legislation, each case must be notified to state and territory health authorities. Notifications are received from hospitals, GPs and diagnostic laboratories. While each Australian state and territory has its own set of notifiable diseases, a set of 56 diseases and conditions is nationally notifiable. Data on all these cases are forwarded to the National Notifiable Diseases Surveillance System (NNDSS), managed by the Australian Government Department of Health and Ageing. The numbers of notifications, however, represent a variable proportion of all the actual cases of any disease.
In South Australia, Western Australia and the Northern Territory the reporting of Indigenous status has been relatively complete for most diseases reported to the NNDSS (Menzies, McIntyre & Beard 2004).
Notification rates among Indigenous Australians are higher than among other Australians for many notifiable diseases including intestinal diseases (e.g. salmonellosis) and STIs. Rates of STIs were higher among Indigenous people than among other Australians, with the rates for syphilis and gonococcal infection among Indigenous people 93 and 43 times the rates among other Australians (table 7.34). Rates of Hepatitis A, B and C infections were also higher in Indigenous Australians than in other Australians. The substantially higher levels of chlamydia, gonococcal infection and syphilis infection among Indigenous Australians compared to other Australians may also facilitate human immunodeficiency virus (HIV) transmission in the Indigenous population (Grosskurth et al. 1995).
7.34 Notification of selected diseases, by Indigenous status - 2003 |
|  |
 | Indigenous | Other |  |  |
 | Observed | Expected | Observed | Ratio(a) |  |
|  |
| Gonococcal infection | 2 152 | 50 | 998 | 43 |  |
| Chlamydial infection | 2 050 | 298 | 5 308 | 7 |  |
| Syphilis(b) | 377 | 4 | 100 | 93 |  |
| Salmonellosis | 255 | 70 | 1 165 | 4 |  |
| Hepatitis A | 37 | 5 | 102 | 8 |  |
| Hepatitis C | 37 | 9 | 180 | 4 |  |
| Tuberculosis | 25 | 4 | 117 | 7 |  |
| Ross River virus infection | 22 | 26 | 793 | 1 |  |
| Meningococcal infection | 16 | 5 | 73 | 3 |  |
| Pertussis | 13 | 23 | 481 | 1 |  |
| Donovanosis(c) | 7 | - | - | - |  |
| Hepatitis B | 7 | 3 | 63 | 3 |  |
| Haemophilus influenzae type b | 2 | - | 3 | 10 |  |
| Mumps | 1 | 1 | 24 | 1 |  |
| Measles | - | 2 | 25 | - |  |
| Rubella | - | - | 4 | - |  |
| Leprosy | - | - | 1 | - |  |
|  |
| - nil or rounded to zero (including null cells) |
| (a) Ratio is observed Indigenous notifications divided by expected Indigenous notifications. Expected notifications are based on the age and disease-specific rates for 'Other' Australians. |
| (b) Includes cases of more than two years or unknown duration. |
| (c) Donovanosis is not notifiable in South Australia. |
| Department of Health and Ageing, National Notifiable Disease Surveillance System |
| Data for South Australia, Western Australia and the Northern Territory. Adequate levels of Indigenous identification are defined as at least 60% for a substantial majority of the diseases analysed. |
Notifications of HIV infections are forwarded to the National Centre in HIV Epidemiology and Clinical Research (NCHECR). Recording of Indigenous status in all jurisdictions is considered reliable. Between 2000-02, 53 notifications of newly diagnosed HIV infection were recorded in the Indigenous population. In this period the incidence rate of HIV was similar for Indigenous males and non-Indigenous males. However, the incidence rate of HIV infection was three times as high for Indigenous females as for non-Indigenous females.
The annual NCHECR surveillance report on HIV/AIDS, viral infections and STIs shows that, while the incidence rate of AIDS diagnosis in both the Indigenous and non-Indigenous populations has declined from a peak in 1994, the rate of decline in AIDS diagnoses in the Indigenous population is significantly slower than among non-Indigenous Australians. Differences in the rate of decline in AIDS diagnoses between Indigenous and non-Indigenous Australians may be due to changes in Indigenous identification over time and to differences in access to treatment and the uptake or effectiveness of antiretroviral treatment for HIV infection (NCHECR 2002).
In the period 2000-02, HIV in males was most commonly contracted through male homosexual or bisexual contact (53% of Indigenous cases and 71% of non-Indigenous male cases). The large majority of female HIV infections were contracted through heterosexual contact (74% of Indigenous cases and 89% of non-Indigenous cases). A much larger proportion of Indigenous males and females who contracted HIV were exposed to HIV through injecting drug use (24% and 21% respectively), than were non-Indigenous males and females (3% and 4% respectively).
Prevalence of blood-borne virus among prison entrants
The National Prison Entrants’ Blood-borne Virus Study was the first national survey of prisoners conducted in Australia. Approximately 602 prisoners entering the criminal justice system were surveyed in 2004, 17% of whom were Indigenous. The survey collected information on Hepatitis C, Hepatitis B, HIV, drug-injecting status and risk behaviours (e.g. tattooing and sexual activity) among prison entrants. The study found that 64% of Indigenous prisoners surveyed (64 of 100 prisoners) reported that they injected drugs, compared with 58% of other prisoners (285 of 494 prisoners). Similar rates of Hepatitis C antibody were found in Indigenous prisoners (38% or 29 out of 77) and other prisoners (34% or 124 out of 366). Only 2% of non-Indigenous respondents and none of the Indigenous respondents had received treatment for Hepatitis C. Indigenous respondents were more likely to have been exposed to Hepatitis B (antibody positive) than other respondents (29% compared with 18%).
Hospitalisations due to infectious and parasitic diseases
In 2003-04, infectious and parasitic diseases, which include illnesses such as STIs, intestinal infectious diseases, viral infections and fevers, tuberculosis, mycoses and other bacterial infections, were responsible for 2,581 hospitalisations of Indigenous males, representing 3% of all hospitalisations of Indigenous males. For Indigenous females, the comparative figure was 2,488 hospitalisations, representing 2% of all hospitalisations of Indigenous females.
Indigenous males and females were hospitalised for infectious and parasitic diseases twice as often as other Australian males and females. The highest rates of hospitalisation for infectious and parasitic diseases occurred in Indigenous children aged 0-4 years. Most of the hospitalisations in this age group were of Indigenous infants (less than one year old) who were hospitalised at rates of 103 and 95 per 1,000 population for males and females respectively. Indigenous infants were hospitalised at three times the rate of other infants. Indigenous males and females aged 0-4 years and 25-44 years were hospitalised at around twice the rate, and Indigenous males and females aged 45-64 years at around three times the rate, of other males and females respectively (graphs 7.35 and 7.36).
7.35 Male rates of hospitalisation for infectious and parasitic diseases(a), by Indigenous status - 2003-04
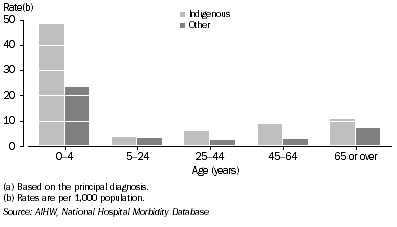 7.36 Female rates of hospitalisation for infectious and parasitic diseases(a), by Indigenous status - 2003-04
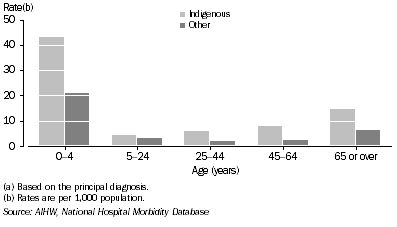
Sexually transmitted infections caused Indigenous males to be hospitalised at four times the rate and Indigenous females at six times the rate of other Australian males and females (table 7.37). Intestinal infectious diseases were responsible for 1% of all hospitalisations of Indigenous males and females, and Indigenous people were hospitalised twice as often as expected, based on the hospitalisation rate for other Australians.
7.37 Hospitalisations for infectious and parasitic diseases(a), Indigenous persons - 2003-04 |
|  |
 |  | Males | Females |  |
 |  | Observed | Expected | Ratio(b) | Observed | Expected | Ratio(b) |  |
|  |
| Intestinal infectious diseases (A00-A09) | 1 332 | 667 | 2.0 | 1 210 | 643 | 1.9 |  |
| Tuberculosis (A15-A19) | 42 | 8 | 5.1 | 27 | 6 | 4.4 |  |
| Other bacterial diseases (A30-A49) | 357 | 124 | 2.9 | 415 | 104 | 4.0 |  |
 | Septicaemia (A40-A41) | 284 | 79 | 3.6 | 349 | 66 | 5.3 |  |
 | Pneumococcal septicaemia (A40.3) | 25 | 6 | 3.8 | 16 | 5 | 3.0 |  |
| Infections, sexual transmission (A50-B64) | 44 | 10 | 4.3 | 138 | 21 | 6.5 |  |
| Viral infections (A80-B19) | 191 | 145 | 1.3 | 190 | 128 | 1.5 |  |
 | Viral hepatitis (B15-B19) | 42 | 37 | 1.1 | 40 | 22 | 1.8 |  |
| All other infectious and parasitic diseases | 615 | 415 | 1.5 | 508 | 361 | 1.4 |  |
| Total | 2 581 | 1 369 | 1.9 | 2 488 | 1 263 | 2.0 |  |
|  |
| (a) Based on the principal diagnosis. |
| (b) Ratio is observed hospitalisations divided by expected hospitalisations. Expected hospitalisations are based on the age, sex and cause-specific rates for 'Other' Australians. |
| AIHW, National Hospital Mobidity Database |
Musculoskeletal conditions
Musculoskeletal conditions, including arthritis, are a major cause of pain and disability in Australia’s ageing population. Arthritis is a heterogenous group of disorders in which there may be inflammation of the joints, causing chronic pain, stiffness, functional limitations and deformity. Its two most common forms are osteoarthritis and rheumatoid arthritis. Although arthritis and musculoskeletal conditions are not usually immediately life-threatening, they are a major cause of disability.
During 2001, about 23% of Aboriginal and Torres Strait Islander people reported a long-term musculoskeletal condition. Indigenous Australians living in non-remote areas were more likely to report a long-term musculoskeletal condition (26%) than those living in remote areas (17%). Higher prevalence was reported among Indigenous Australians than among non-Indigenous Australians for all age groups, except those aged 55 years or over.
The age-standardised prevalence of musculoskeletal conditions among Indigenous Australians is similar to that among non-Indigenous Australians. However, after adjusting for age, Indigenous Australians were more than twice as likely to report some form of arthritis than non-Indigenous Australians.
In 2003-04, diseases of the musculoskeletal system and connective tissue were responsible for 3,858 hospitalisations of Aboriginal and Torres Strait Islander people (53% were for males and 47% were for females), representing around 2% of all Indigenous hospitalisations. Hospitalisation rates for musculoskeletal diseases were about 5 per 1,000 for people aged 15-24 years and 27 and 37 per 1,000 population for males and females aged 75 years or over. Among people aged 15 years or over, hospitalisation rates for Indigenous males and females were lower than for other males and females.
Of all musculoskeletal diseases, arthritis was the most common cause of hospitalisation for Indigenous Australians. Indigenous Australians were hospitalised for arthritis at twice the rate of other Australians.
Eye and vision problems
There are few data sources about vision problems among Indigenous Australians. Self-reported data on the prevalence of blindness and visual impairment are available from the NHS. In 2001, the prevalence of eye and vision problems (including long and short sightedness, total or partial loss of vision, cataract and other diseases of the eye) among Indigenous Australians was 29%. Within the Indigenous population, those living in non-remote areas were more likely to report eye and sight problems (33%) than those living in remote areas (20%). The prevalence of eye and vision problems increased with age, to 88% and 96% respectively, for Indigenous and non-Indigenous Australians aged 55 years or over.
The age-standardised prevalence of eye and vision problems among Indigenous Australians of all ages was less than that among non-Indigenous Australians. This pattern was consistent across all age groups (ABS 2002b).
More serious eye diseases and conditions include partial or total vision loss, cataract and, among Indigenous Australians, trachoma. The age-standardised prevalence rate of total or partial loss of vision is 4% among Indigenous Australians and 3% among non-Indigenous Australians. There are no authoritative data for the prevalence of cataracts, trachoma, age-related macular degeneration (AMD) and glaucoma among older Indigenous Australians.
Cataracts
A cataract is a clouding of the eye’s naturally clear lens that causes vision to become poor, as if looking through a frosty window. Cataracts have a greater impact on the vision of Indigenous Australians as they occur more frequently, and presentation for cataract surgery usually occurs at a more advanced stage than for other Australians (Holden 2000; Taylor 1997). This is due in part to later diagnosis, and concerns about moving away from the community for surgery.
There are no data on the prevalence of cataract for Indigenous Australians based on ophthalmic examination. The age-standardised prevalence of cataract based on self-reporting is 3% among Indigenous Australians, compared with 2% among non-Indigenous Australians (ABS 2002b). Cataracts are more commonly reported by Indigenous men (5%) than women (2%).
In 2003-04 there were 1,032 cataract procedures performed in Australian hospitals on Aboriginal and Torres Strait Islander people. The overall cataract procedure rate among Indigenous Australians was similar to the rate among other Australians.
Diabetic retinopathy
Diabetic retinopathy is likely to be a significant vision-threatening condition among Indigenous Australians because of the high rate of Type II diabetes in some communities. Limited data are available on the prevalence of diabetic retinopathy among Indigenous Australians. Two studies conducted in the Katherine region of the Northern Territory in 1993 and 1996 reported prevalence rates of 18% and 21% respectively for diabetic retinopathy among Indigenous Australians with diabetes (Jaross, Ryan & Newland 2003). A non-random study in the Pilbara region, Western Australia estimated the prevalence to be 23% (Diamond et al. 1998). These studies are not designed to support ready comparisons with rates for other Australians. However, since the prevalence rate of diabetes is higher among Indigenous Australians, the data suggest that the rate of diabetic retinopathy in Indigenous Australians will also be higher.
Trachoma and Trichiasis
Trachoma is a conjunctivitis caused by infection with the bacterium Chlamydia trachomatis. It is an acute inflammatory condition which usually occurs in childhood. Repeated infections can lead to scarring of the tissues of the eyelid over time. High prevalence rates of trachoma have been associated with poor environmental health conditions, inadequate hygiene, overcrowding, low socioeconomic status and an arid environment (Ewald et al. 2003; Taylor et al. 2003). While there is evidence of high prevalence of trachoma in some areas of Western Australia, South Australia and the Northern Territory, where rates as high as 60% were reported among children (OATSIH 2001), there are no data available for New South Wales, Victoria, Queensland and Tasmania (Taylor et al. 2003). A study of trachoma in a large remote Central Australian Aboriginal community during 1998-2000 found the prevalence of trachoma among children aged less than 13 years to be 40% at the start of the study period. This changed little over the following 21 months (Ewald et al. 2003).
Trichiasis is a sight-threatening complication of trachoma which affects mainly older Aboriginal and Torres Strait Islander people. In people with the condition, the margin of eyelid and eyelashes turn inwards and the rubbing of the eyelashes on the cornea leads to corneal damage and blindness in later life. Prevalence data for trichiasis are limited. A 1998 study of trichiasis among people aged 50 years or over in the Kimberley found an overall prevalence rate of 3%. The rate was 11% in the Halls Creek Shire, which is also the area of highest trachoma prevalence in the Kimberley (Mak & Plant 2001).
Hospitalisations for eye and vision problems
In 2003-04 there were 1,443 hospitalisations of Indigenous people due to eye and vision problems, representing about 1% of all hospitalisations of Indigenous people. The overall rates of hospitalisations for diseases of the ‘eye and adnexa’ (appendages of the eyeball which include the eyelids, muscles and soft tissue) among Indigenous Australians were similar to those for other Australians. Rates of hospitalisation due to diseases of the eye were 36 and 40 per 1,000 for Indigenous males and females aged 65 years or over, and 49 and 58 per 1,000 for other males and females.
Ear and hearing problems
Long-term ear and hearing problems were commonly reported by Australians in 2001 (ABS 2002c). The prevalence of ear and hearing problems in the Indigenous population was 15%. Prevalence increased with age from 11% of Indigenous people aged 0-14 years to 29% of those aged 55 years or over. After adjusting for age differences in the populations, the prevalence of ear and hearing problems and of total or partial hearing loss in the Indigenous population was 1.3 times the rate in the non-Indigenous population.
Aboriginal and Torres Strait Islander children are twice as likely to be recorded as having ear and hearing problems as other Australian children. This is due in part to high rates of otitis media (middle ear infection) among children in many Indigenous communities (Couzos, Metcalf & Murray 2001). Otitis media, a common childhood disease, is often the result of a pneumococcal invasion of the nasopharynx. Recurrence of chronic otitis media is often characterised by a perforated eardrum, which can lead to hearing loss, deafness and further complications such as learning difficulties (Chapter 3). The World Health Organization (2003) recognises that the prevalence of otitis media greater than 4% in a population is indicative of a public health problem. Otitis media affects up to ten times this proportion of children in many Indigenous communities (up to 40%) (Coates et al. 2002).
Hospitalisations for ear and hearing problems
In 2003-04, there was a total of 1,807 hospitalisations of Indigenous people for ‘diseases of the ear and mastoid process’ (temporal bone behind the ear), representing 1% of all hospitalisations of Indigenous people. Hospitalisation rates for ear and hearing problems among Indigenous Australians were similar to those of other Australians.
In 2003-04, 64% of all hospitalisations for ear and hearing problems among Indigenous people were due to otitis media, compared with 55% of hospitalisations of other Australians. Chronic ear and hearing problems were also more common among Indigenous children than among other Australian children. Indigenous children and young adults experience an average of 32 weeks of middle ear infection between the ages of two and 20 years, compared with an average of two weeks for non-Indigenous people (Coates 2002).
Oral health
Oral health refers to the health of a number of tissues in the mouth, including mucous membrane, connective tissue, muscles, bone, teeth and periodontal structures or gums. It may also refer to immunological, physiological, sensory and digestive system functioning, but is most often used to refer to two specialised tissues of the mouth: the teeth and the gums (AIHW 2000).
In 2003-04 there were approximately 2,000 hospitalisations of Indigenous people for diseases of the oral cavity, salivary glands and jaw. The majority of these hospitalisations were for dental caries (54%), followed by diseases of the pulp and periapical tissues (16%) and embedded and impacted teeth (9%).
Child dental health
Data on the dental health of Australians is collected by the Dental Statistics and Research Unit (DSRU), a collaborating unit of the AIHW. The Child Dental Health Survey is a national survey which monitors the dental health of children enrolled in school dental services operated by health departments in all states and territories. In 2001, Indigenous status was recorded reliably and for sufficient numbers of children in New South Wales, South Australia and the Northern Territory. Data from those jurisdictions are used in this section.
Oral health outcomes are usually measured in terms of dental health, which is measured in terms of the number of decayed, missing or filled baby (deciduous) and adult (permanent) teeth. Another measure of good oral health is the proportion of children with no tooth decay. Dental decay is expressed as the number of teeth currently decayed, teeth extracted due to decay, and teeth with fillings (dmft and DMFT scores; AIHW 2000). The dmft score measures decay experience in deciduous teeth, while the DMFT score measures decay experience in permanent teeth.
In New South Wales, South Australia and the Northern Territory, the mean dmft for Indigenous children aged 4-10 years was higher than for non-Indigenous children (table 7.38). The difference in the mean dmft score among Indigenous and non-Indigenous children was particularly high among those aged less than seven years. In general, mean dmft scores were highest for Indigenous children at about five years of age, compared with an age of about 7-8 years for non-Indigenous children.
Mean DMFT in Indigenous children aged 6-15 years was also greater than for non-Indigenous children in all three jurisdictions (table 7.38). Among 12-year-olds, the DMFT was approximately 60% higher for Indigenous than for non-Indigenous children in all three jurisdictions.
It appears that children in New South Wales have lower scores than those in South Australia and the Northern Territory. One possible explanation is the level of fluoride consumption. Fluoride has a well recognised role in the prevention of dental decay. The concentration of fluoride in public water supplies differs by location, with Sydney having a higher level (0.9-1.1 ppm), Adelaide a slightly lower level (0.8-1.0ppm) and Darwin the lowest level of the three cities (0.6-0.65) (Ahokas et al. 1999). However, as the amount of fluoride intake depends on water consumption, the concentration is meant to be higher in cooler climates and lower in warmer climates (University of Adelaide 1997).
7.38 Mean number of decayed, missing and filled teeth, children aged 4-15 years - 2001 |
|  |
 | New South Wales | South Australia | Northern Territory |  |
| Age (years) | Indigenous | Non- Indigenous | Indigenous | Non- Indigenous | Indigenous | Non- Indigenous |  |
dmft(a) |  |
|  |
| Four | 2.4 | 1.0 | 3.4 | 1.3 | 3.4 | 1.1 |  |
| Five | 2.3 | 0.9 | 3.6 | 1.5 | 4.1 | 1.4 |  |
| Six | 2.1 | 1.0 | 4.0 | 1.9 | 3.9 | 1.7 |  |
| Seven | 1.7 | 1.1 | 3.2 | 2.0 | 3.7 | 1.7 |  |
| Eight | 1.8 | 1.1 | 3.3 | 2.0 | 3.0 | 1.8 |  |
| Nine | 1.4 | 1.0 | 3.0 | 2.0 | 2.4 | 1.7 |  |
| Ten | 1.0 | 0.8 | 1.9 | 1.9 | 1.7 | 1.1 |  |
DMFT(b) |  |
|  |
| Six | 0.1 | - | 0.2 | 0.1 | 0.1 | 0.1 |  |
| Seven | 0.2 | 0.2 | 0.4 | 0.2 | 0.3 | 0.2 |  |
| Eight | 0.4 | 0.2 | 0.5 | 0.3 | 0.5 | 0.2 |  |
| Nine | 0.4 | 0.3 | 0.9 | 0.5 | 0.6 | 0.3 |  |
| Ten | 0.6 | 0.3 | 1.1 | 0.6 | 0.9 | 0.4 |  |
| Eleven | 0.6 | 0.4 | 1.1 | 0.7 | 1.0 | 0.5 |  |
| Twelve | 0.9 | 0.5 | 1.3 | 0.8 | 1.1 | 0.7 |  |
| Thirteen | 1.0 | 0.7 | 1.8 | 1.1 | 1.9 | 0.8 |  |
| Fourteen | 1.4 | 0.8 | 2.4 | 1.3 | 1.9 | 1.5 |  |
| Fifteen | na | na | 2.8 | 1.7 | 1.6 | 0.9 |  |
|  |
| - nil or rounded to zero (including null cells) |
| na not available |
| (a) Decayed, missing and filled deciduous teeth for children aged 4-10 years |
| (b) Decayed, missing and filled permanent teeth for children aged 6-15 years |
| AIHW, Dental Statistics Research Unit |
The Western Australian Aboriginal Child Health Survey (WAACHS) conducted during 2001 and 2002 collected information on tooth cavities, tooth extraction and sore/bleeding gums in Aboriginal children. Overall, 38% of children had experienced tooth decay, tooth removals or fillings. Almost half of children aged 4-17 years had at least one dental problem (Zubrick et al. 2004).
An estimated 19% of Aboriginal children were reported by their carers to have holes in their teeth. The prevalence of cavities was highest for children aged 4-7 years at 31%. Almost one in ten Aboriginal children aged 0-17 years were reported to have ever had a tooth removed. An estimated 28% of children had had at least one tooth filled, the highest proportion being among children aged 8-11 years. Sore or bleeding gums were experienced by 6% of all children surveyed. The prevalence of sore or bleeding gums was highest among Aboriginal children aged 12-17 years (8%).
Adult dental health
The Adult Dental Programs Survey takes place every five years and monitors the oral health of adults who receive public-funded dental care. The 2000-01 survey collected data on 5,243 patients, 3% of which were Indigenous. Another survey which contains information on adult oral health is the National Dental Telephone Interview Survey. This survey involves periodic telephone interviews every two-and-a-half years of a general population sample of people aged five years or over. It collects data on access to dental care, self-assessed dental health status, present dental health needs, use of dental services and preventive behaviours, satisfaction with dental services, and experience of and attitudes to dentistry. An investigation of data collected over the period 1994-96 focused on migrants, Indigenous Australians, and rural and remote dwellers. These reports identified a less favourable level of dental health and access to dental care for these subgroups in Australia.
In 1999-2000, after adjusting for age, cumulative history of dental decay among Aboriginal Dental Clinic (ADC) patients in remote communities in South Australia was approximately 50% lower than for each of the other three groups studied in non-remote areas - ADC patients in Adelaide, Aboriginal patients of public dental clinics in non-remote South Australia and New South Wales, and Aboriginal patients in regional New South Wales.
Untreated decay was responsible for the majority of dental problems experienced in people aged 18-24 years while missing teeth was the predominant dental problem for people in the oldest age group. In remote areas, almost 75% of dental problems in the oldest age group were caused by missing teeth.
Mental health and social and emotional wellbeing
Mental health for Indigenous Australians cannot be separated from their overall social and emotional wellbeing. Social and emotional wellbeing is a holistic concept and is dependent on individual, family and community experience. It can influence not only a person’s physical health but also the health of their family and community relationships. Among Indigenous Australians, social and economic disadvantage contributes to high rates of physical and mental health problems, and factors such as high adult mortality, suicide rates, child removals and incarceration rates contribute to higher rates of grief, loss and trauma (Social Health Reference Group 2003).
There are no national data yet on the prevalence of mental illness and the social and emotional wellbeing of Aboriginal and Torres Strait Islander people. The 2004-05 ABS National Aboriginal and Torres Strait Islander Health Survey included for the first time a component on social and emotional wellbeing. Results are expected to be available in 2006. The second volume of the WAACHS, published in April 2005, focuses on the social and emotional wellbeing of Aboriginal children and young people. Information from this survey is presented in Chapter 6. Information related to the mental health of Indigenous people presented here includes hospitalisations for mental and behavioural disorders, and deaths in custody.
In 2003-04 there were 4,954 hospitalisations of Indigenous males and 4,604 hospitalisations of Indigenous females for mental and behavioural disorders. This represented 5% and 4% of all hospitalisations of Indigenous males and females respectively. Indigenous males and females were up to twice as likely to be hospitalised for mental and behavioural disorders as other Australians.
There were more hospitalisations of Indigenous Australians than other Australians for most types of mental and behavioural disorders (table 7.39). In particular, hospitalisations for ‘mental and behavioural disorders due to psychoactive substance use’ were around four and three times the rate for Indigenous males and females respectively.
Hospitalisation rates for mental and behavioural disorders were highest among people aged 25-44 years, where rates for Indigenous males were three times those for other males, and rates for Indigenous females were twice those for other females.
7.39 Hospitalisations for mental and behavioural disorders(a), Indigenous persons - 2003-04 |
|  |
 | Males | Females |  |
 | Observed | Expected | Ratio(b) | Observed | Expected | Ratio(b) |  |
|  |
| Mental disorders due to psychoactive substance use (F10-F19) | 2 305 | 525 | 4.4 | 1 208 | 368 | 3.3 |  |
| Mood and neurotic disorders (F30-F48) | 973 | 950 | 1.0 | 2 035 | 1 807 | 1.1 |  |
| Schizophrenia, schizotypal and delusional disorders (F20-F29) | 1 398 | 609 | 2.3 | 1 033 | 421 | 2.5 |  |
| Organic mental disorders (F00-F09) | 63 | 35 | 1.8 | 64 | 34 | 1.9 |  |
| All other mental disorders | 215 | 283 | 0.8 | 264 | 462 | 0.6 |  |
| Total | 4 954 | 2 402 | 2.1 | 4 604 | 3 091 | 1.5 |  |
|  |
| (a) Based on the principal diagnosis. |
| (b) Ratio is observed hospitalisations divided by expected hospitalisations. Expected hospitalisations are based on the age, sex and cause-specific rates for 'Other' Australians. |
| AIHW, National Hospital Morbidity Database |
Hospitalisation rates for injury, such as assault or intentional self-harm, may also be indicative of mental illness and distress. In 2003-04 Indigenous Australians were more likely to be hospitalised as a result of assault than were other Australians (around seven times as likely for Indigenous males and 31 times as likely for Indigenous females). Indigenous Australians also had a higher rate of hospitalisation for intentional self-harm than other Australians (twice as high for both Indigenous males and Indigenous females) (see table 7.30).
Mental illness and/or emotional distress may not only cause Indigenous Australians to come into contact with the criminal justice system, but incarceration may be a risk factor for mental illness (HREOC 1993). Incarceration separates Indigenous people from their communities and culture. Indigenous prisoners frequently experience depressive symptoms associated with unresolved anger which can result in suicide attempts. The number of Indigenous deaths in custody was also relatively high. Of the 68 deaths in custody in 2003, 17 (25%) were Indigenous people (McCall 2004).
 Print Page
 Print All