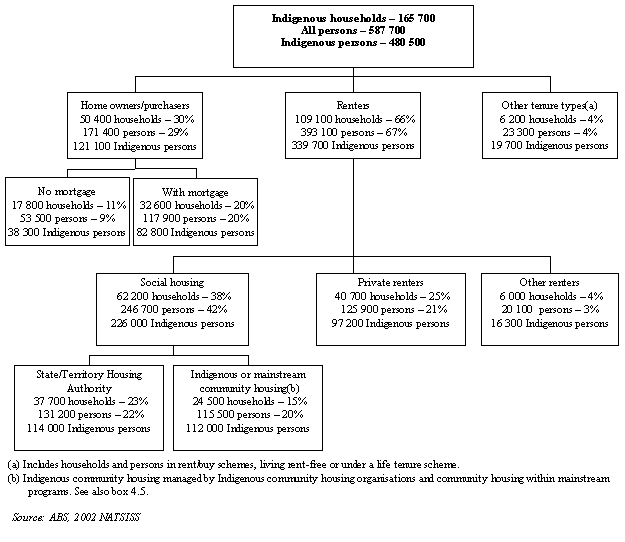
Among the estimated 165,700 Indigenous households in 2002, 30% were home owners or purchasers, 38% were renters of some form of social housing and 28% were private or other renters (figure 4.1). This can be compared with all Australian households where 70% were home owners or purchasers, 6% were renters of social housing and 21% were private or other renters (ABS 2002 General Social Survey (GSS)).
Home ownership provides a relatively secure form of housing tenure but there are much lower rates of home ownership among Indigenous households. This is indicative of the lower socioeconomic status of many Indigenous households, and the small proportion of owner/purchaser households in very remote areas reflects, among other things, the types of tenure available on traditional Aboriginal and Torres Strait Islander lands (ABS 2003c). In 2002, 11% of Indigenous households owned their homes outright and 20% were purchasing their homes.
4.1 Indigenous households and persons, by tenure type - 2002

The majority of Indigenous households (66%) lived in some form of rental accommodation. The largest group were renters in social housing, which included households renting from state or territory housing authorities (23%) and households renting from Indigenous or mainstream community housing organisations (15%). One-quarter of Indigenous households were in the private rental market.
The distribution of Indigenous people by the tenure type of the household in which they live is similar to the distribution of Indigenous households by tenure type (figure 4.1). The major difference occurs for Indigenous or mainstream community housing. Reflecting the generally large size of these households relative to households with other tenure types, the proportion of people in Indigenous or mainstream community housing (23%) is higher than the proportion of households with this tenure type (15%). Information on the distribution of Indigenous persons, in addition to Indigenous households, is shown in selected tables in this chapter.
Trends in housing tenure
Between 1994 and 2002 the proportion of Indigenous home owner households increased from 26% to 30%. This change was due to an increase in home purchaser households (from 13% to 20%). The proportion of renter households fell slightly from 69% to 66%. Declines in the proportion renting from state/territory housing authorities (from 35% to 23%) were mostly offset by increases in households renting privately (from 23% to 28%) and in those renting from Indigenous or mainstream community housing organisations (from 11% to 15%; table 4.2).
4.2 Indigenous households and Indigenous persons(a), by tenure type - 1994 and 2002 |
|  |
 |  | Persons | Households |  |
 |  | 1994 | 2002 | 1994 | 2002 |  |
|  |
| Fully owned | % | 10.9 | 9.7 | 12.7 | 10.8 |  |
| Being purchased | % | 10.8 | 16.8 | 12.8 | 19.7 |  |
| Renter state/territory housing authority | % | 33.3 | 22.1 | 34.7 | 22.7 |  |
| Renter Indigenous/mainstream community housing | % | 16.6 | 24.0 | 11.0 | 14.8 |  |
| Private and other renter | % | 20.9 | 23.6 | 23.0 | 28.2 |  |
| Other tenure(b) | % | 5.1 | 3.8 | 3.9 | 3.7 |  |
| Total(c) | % | 100.0 | 100.0 | 100.0 | 100.0 |  |
| Total | no. | 214 600 | 282 200 | 108 500 | 165 700 |  |
|  |
| (a) Aged 15 years or over. |
| (b) Includes persons living under life tenure schemes, those living rent-free, and participants in rent/buy schemes. |
| (c) Includes renters whose landlord was not stated. |
| ABS, 1994 NATSIS and 2002 NATSISS |
Tenure by location
States and territories
The housing tenure of Indigenous households varies by location. The Northern Territory had the lowest proportion of Indigenous households who were home owners (13%) and the highest proportion living in Indigenous or mainstream community housing (48%) (table 4.3).
The proportion of home owners was highest in the eastern states of Victoria (36%), New South Wales (32%) and Queensland (30%). The proportion of private and other renters was also highest in New South Wales (32%), Queensland (31%) and Victoria (30%).
Western Australia (32%) and South Australia (27%) had a relatively high proportion of households renting from the state housing authority.
4.3 Indigenous households and persons(a), by tenure type and state or territory - 2002 |
|  |
 |  | NSW | Vic. | Qld | SA | WA | NT | Australia(b) |  |
Persons |  |
|  |
| Home owner/purchaser | % | 32.2 | 34.5 | 26.6 | 27.6 | 18.4 | 7.6 | 26.5 |  |
| Renter state/territory housing authority | % | 22.2 | 22.5 | 21.8 | 25.8 | 31.7 | 10.9 | 22.1 |  |
| Renter Indigenous/mainstream community housing | % | 12.3 | 9.6 | 23.2 | 26.6 | 22.6 | 67.8 | 24.0 |  |
| Private and other renter | % | 28.8 | 30.1 | 26.4 | 18.0 | 22.3 | *7.4 | 23.6 |  |
| Other tenure | % | *4.3 | *3.3 | *2.0 | *1.5 | *5.0 | *6.3 | 3.8 |  |
| Total | no. | 83 800 | 17 400 | 76 000 | 15 800 | 39 600 | 36 200 | 282 200 |  |
Households |  |
|  |
| Home owner/purchaser | % | 32.0 | 36.6 | 30.3 | 29.2 | 23.4 | *13.5 | 30.4 |  |
| Renter state/territory housing authority | % | 22.4 | 21.1 | 20.6 | 27.1 | 31.6 | *17.5 | 22.8 |  |
| Renter Indigenous/mainstream community housing | % | 9.5 | 8.9 | 15.6 | 19.8 | 13.9 | 48.4 | 14.8 |  |
| Private and other renter | % | 31.8 | 30.1 | 31.4 | 21.9 | 24.9 | *15.1 | 28.2 |  |
| Other tenure | % | *4.1 | *3.3 | *2.0 | *2.1 | 6.2 | *5.6 | 3.7 |  |
| Total | no. | 55 900 | 12 300 | 44 200 | 9 600 | 20 900 | 12 600 | 165 700 |  |
|  |
| * estimate has a relative standard error of 25% to 50% and should be used with caution |
| (a) Aged 15 years or over. |
| (b) Includes persons and households in Tasmania and the Australian Capital Territory. |
| ABS, 2002 NATSISS |
| Numbers are rounded to the nearest hundred. |
Geographic area
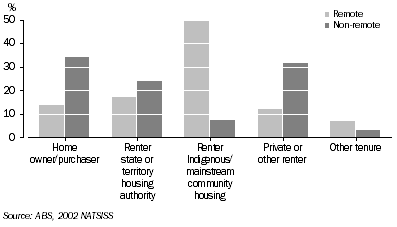
According to the 2002 NATSISS, 29,200 Indigenous households were in remote areas of Australia and 136,500 were in non-remote areas. Tenure type varied by remoteness, reflecting the availability of different housing options for Indigenous people and the lower socioeconomic status of those in remote areas.
Among Indigenous households living in remote areas of Australia, one-half (50%) were renters of Indigenous or mainstream community housing, 17% were renters of state or territory housing and 14% were home owners. Among Indigenous households in non-remote areas, the highest proportion were home owners (34%) followed by private or other renters (32%) and renters of state and territory housing (24%) (graph 4.4).
4.4 Indigenous households, by tenure type and remoteness - 2002

 Print Page
 Print All