Balance on current account, (from Table 2.1)
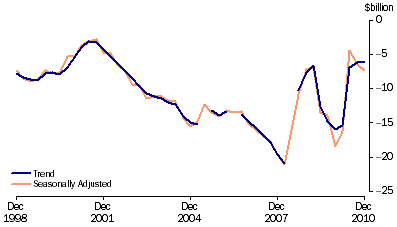 Source: Balance of Payments and International Investment Position, Australia, (cat. no. 5302.0)
Goods, (from Table 2.1) Trend
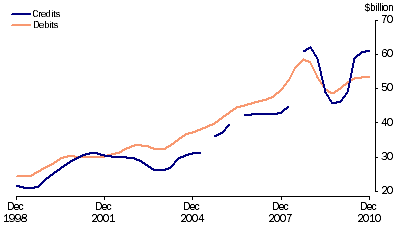
Source: Balance of Payments and International Investment Position, Australia, (cat. no. 5302.0)
Financial account, (from Table 2.2) Selected types of investment
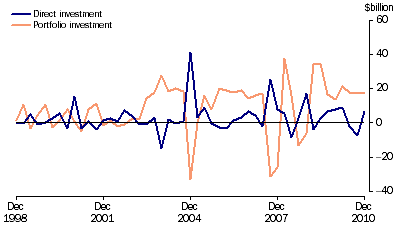
Source: Balance of Payments and International Investment Position, Australia, (cat. no. 5302.0)
Components of goods credits, (from Table 2.3) Chain volume measure-Seasonally adjusted
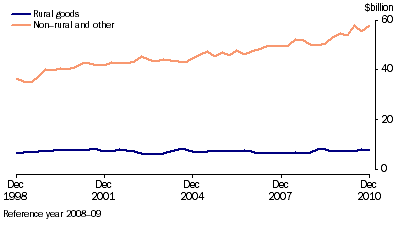
Source: Balance of Payments and International Investment Position, Australia, (cat. no. 5302.0)
Components of goods debits, (from Table 2.3) Chain volume measures-Seasonally adjusted
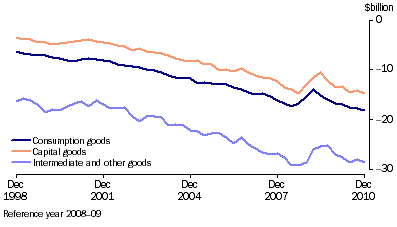
Source: Balance of Payments and International Investment Position, Australia, (cat. no. 5302.0)
Services, (from Table 2.7) Trend
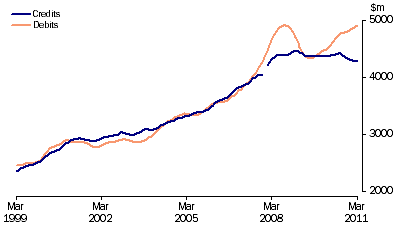
Source: International Trade in Goods and Services, Australia, (cat. no. 5368.0)
Current account to GDP, (from Table 2.11)
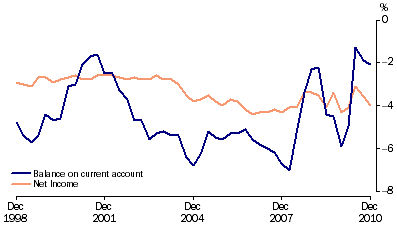
Source: Balance of Payments and International Investment Position, Australia, (cat. no. 5302.0)
Net foreign debt to GDP, (from Table 2.11)
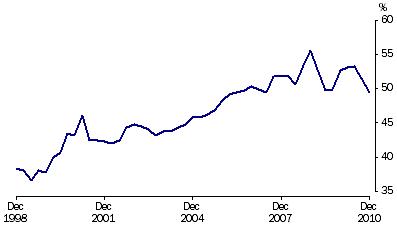
Source: Balance of Payments and International Investment Position, Australia, (cat. no. 5302.0)
Export shares with selected countries and country groups, (from Table 2.13)
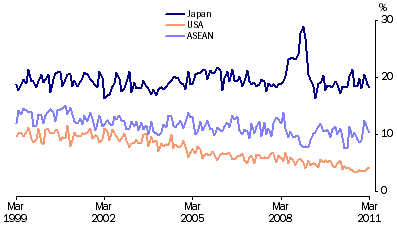
Source: International Trade in Goods and Services, Australia, (cat. no. 5368.0)
Export shares with selected ASEAN countries, (from Table 2.15)
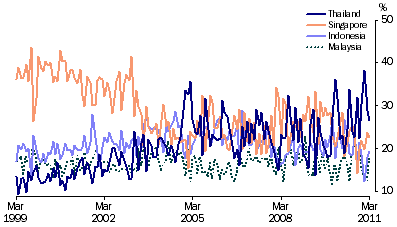
Source: International Trade in Goods and Services, Australia, (cat. no. 5368.0)
Export shares with selected European Union countries, (from Table 2.17)
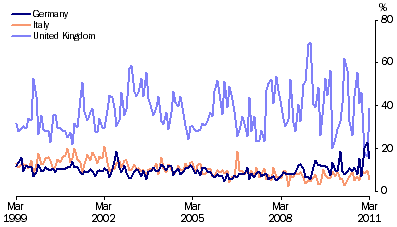
Source: International Trade in Goods and Services, Australia, (cat. no. 5368.0)