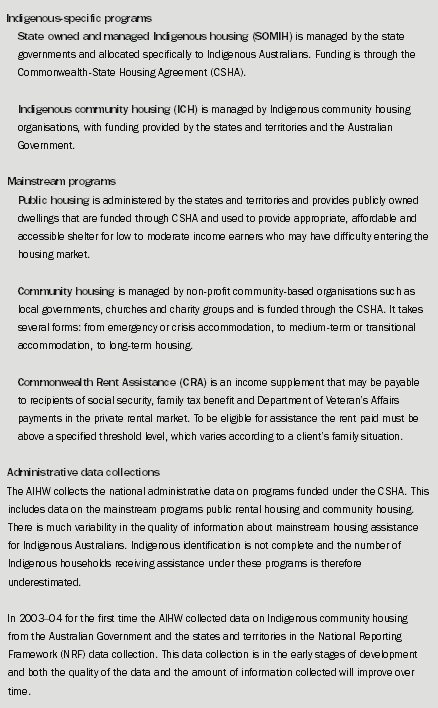
A large proportion of Indigenous households receive housing assistance of some kind (box 4.5). The following analysis is based on Commonwealth-State Housing Agreement (CSHA) and the National Reporting Framework (NRF) administrative data collections. Data on households by tenure type in these administrative collections differ from data based on the 2002 NATSISS. This is due to a number of factors including the under-identification of Indigenous households in both the public and mainstream community housing data collections. The administrative collections and surveys are also based on different reference periods and use different collection methodologies.
4.5 Major housing assistance programs and administrative data collections

At 30 June 2004 these administrative collections recorded around 55,000 Indigenous households receiving assistance under the social housing programs - 21,717 in Indigenous community housing, 19,787 in public rental housing, 12,219 households in State owned and managed Indigenous housing (SOMIH), and 1,316 in mainstream community housing (table 4.6). Indigenous households in public rental housing represented approximately 6% of the total number of households receiving public housing assistance (AIHW 2005f).
The proportion of households in the different housing assistance programs varied across jurisdictions, related to the available housing options. The highest proportion of Indigenous households in Indigenous community housing was in the Northern Territory (30%) followed by Queensland (28%). New South Wales had the highest proportion of households accessing both SOMIH and mainstream community housing followed by Queensland. The highest proportion of Indigenous income units in the Commonwealth Rent Assistance program were in New South Wales (36%) and Queensland (36%). (See Glossary for more information on CRA income units).
4.6 Indigenous households in major housing assistance programs - 30 June 2004 |
|  |
 | NSW | Vic. | Qld | SA | WA | Tas. | NT | ACT | Australia |  |
Number (no.) |  |
|  |
| Indigenous community housing(a) | 4 616 | 476 | 6 079 | 1 093 | 2 837 | 128 | 6 456 | 32 | 21 717 |  |
| SOMIH | 4 007 | 1 219 | 2 720 | 1 751 | 2 187 | 335 | . . | . . | 12 219 |  |
| Public housing | (b)8 700 | 1 078 | 2 633 | 1 171 | 4 041 | 494 | 1 498 | 172 | 19 787 |  |
| Community housing | 588 | 12 | 419 | 65 | 212 | 4 | na | 16 | 1 316 |  |
| Commonwealth Rent Assistance(c) | 9 006 | 1 611 | 8 997 | 1 214 | 2 387 | 744 | 1 032 | na | 25 102 |  |
Proportion (%) |  |
|  |
| Indigenous community housing(a) | 21.2 | 2.2 | 28.0 | 5.0 | 13.1 | 0.6 | 29.7 | 0.1 | 100.0 |  |
| SOMIH | 32.7 | 10.0 | 22.3 | 14.3 | 17.9 | 2.7 | . . | . . | 100.0 |  |
| Public housing | (b)44.0 | 5.4 | 13.3 | 5.9 | 20.4 | 2.5 | 7.6 | 0.9 | 100.0 |  |
| Community housing | 44.7 | 0.9 | 31.8 | 4.9 | 16.1 | 0.3 | na | 1.2 | 100.0 |  |
| Commonwealth Rent Assistance(c) | 35.9 | 6.4 | 35.8 | 4.8 | 9.5 | 2.6 | 4.1 | na | 100.0 |  |
|  |
| . . not applicable |
| na not available |
| (a) Estimated number based on number of dwellings at 30 June 2004. |
| (b) Estimate based on the 2001 Census of Population and Housing, adjusted for undercounting of public housing households. |
| (c) Income units receiving CRA at 11 June 2004. Income units are single persons or family units comprising parents and dependent children. Not all income units are eligible for CRA. |
| AIHW, CSHA data collection and NRF data collection |
SOMIH is provided across all geographic regions, with 34% of SOMIH households in major cities, 48% in regional areas and 17% in remote or very remote areas. Indigenous households in public housing were also located across urban, rural and remote locations, though there was a lower proportion located in very remote areas compared with SOMIH households (table 4.7). At 30 June 2001 most Indigenous income units receiving Commonwealth Rent Assistance were located in major cities or inner regional areas (65%), with only 3% in very remote areas (ABS & AIHW 2003).
4.7 Indigenous households renting from state or territory housing authority, by program type - 2004 |
|  |
 | SOMIH | Public housing(a) | Total |  |
 | no. | % | no. | % | no. | % |  |
|  |
| Major cities | 4 190 | 34.3 | 3 450 | 31.1 | 7 640 | 32.8 |  |
| Inner regional | 2 713 | 22.2 | 1 535 | 13.9 | 4 248 | 18.2 |  |
| Outer regional | 3 184 | 26.1 | 3 426 | 30.9 | 6 610 | 28.4 |  |
| Remote | 1 054 | 8.6 | 1 949 | 17.6 | 3 003 | 12.9 |  |
| Very remote | 1 072 | 8.7 | 724 | 6.5 | 1 796 | 7.7 |  |
| Total | 12 213 | 100.0 | 11 085 | 100.0 | 23 298 | 100.0 |  |
|  |
| (a) The total for public housing differs from that provided in Table 4.6 because of the under-reporting of Indigenous households from New South Wales in the public housing national minimum dataset. |
| AIHW analysis of CSHA data repository. |
 Print Page
 Print All