|
INCOME
Free-standing day hospital facilities received $990.9 million in income during 2013-14, a 4.7% increase from 2012-13. Free-standing day hospitals received 95.7% of their total revenue as patient revenue in 2013-14, up from 95.0% in 2012-13.
The proportion of total income received as patient income varied from to 98.7% of all income in Ophthalmic surgery hospitals to 92.3% of all income in Gastroenterology hospital facilities.
The average income for the 326 Free-standing day hospitals in 2013-14 was $3.0 million. This varied from $4.3 million for the 74 Ophthalmic surgery hospitals to $1.6 million for the 36 Plastic and cosmetic surgery establishments.
Table 3.6 PRIVATE FREE-STANDING DAY HOSPITALS, Income—Type of centre(a)—2013-14
|
 | Gastroenterology (b) | Ophthalmic surgery | Plastic and cosmetic surgery | Gynaecology, Fertility treatment and Family Planning | Other(c) | Total(d) |
|
| Income ($'000) |  |
 | Patient income(e) |  |
 |  | Income from Federal, state and local government | 22,731 | 25,774 | 3,000 | 21,854 | 94,088 | 167,447 |
 |  | Income from private health insurance companies | 108,253 | 231,042 | 27,470 | 18,543 | 177,275 | 562,583 |
 |  | Income from third parties (f) | 1,197 | 2,275 | np | np | np | 9,022 |
 |  | Income direct from patient | 28,974 | 50,901 | 23,192 | 48,212 | 42,860 | 194,139 |
 |  | Total | 165,360 | 313,483 | 55,454 | 91,214 | 322,616 | 948,127 |
 | Recoveries | 7,496 | 3,049 | np | np | 2,744 | 14,310 |
 | Other (g) | 6,303 | 1,084 | np | np | 14,384 | 28,467 |
 | Total (h) | 179,159 | 317,616 | 58,167 | 96,218 | 339,744 | 990,904 |
| Patient income as a proportion of total income (%) | 92.3 | 98.7 | 95.3 | 97.3 | 96.1 | 95.7 |
|
np not available for publication but included in totals where applicable, unless otherwise indicated
(a) See Explanatory Note 25 for further information on categories.
(b) Gastroenterology, including endoscopy.
(c) Including Dental Oral Maxillofacial surgery, Dialysis, Oncology, General surgery, sleep disorders clinic and other types of centre.
(d) Figures have been rounded and discrepancies may occur between totals and the sums of the component items.
(e) Includes income received by, and due to, the hospital in respect of patient liability for accommodation and other fees. See Glossary for further information.
(f)Includes, for example, payments Workcover payments, Motor Vehicle third party claims, workers compensation.
(g) Including investment income, income from charities, bequests, visitors' meals, and accommodation and kiosk sales.
(h) Figures have been rounded and discrepancies may occur between totals and the sums of the component items. |
NSW recorded the highest proportion of all Free-standing day hospital income at 33.2% in 2013-14. Income per hospital ranged from $3.9 million in Queensland to $2.4 million in Victoria. Patient income as a proportion of total income ranged from 99.6% in Tasmania, the Northern Territory and the Australian Capital Territory to 92.2% in South Australia.
Table 3.7 PRIVATE FREE-STANDING DAY HOSPITALS, Income—States and territories—2013-14
|
 | NSW | Vic. | Qld | SA | WA | Tas., NT & ACT(a) | Aus. |
|
| Income ($'000) |  |
 | Patient income ('000) (b) |  |
 |  | Income from Federal, state and local government | 49,162 | 38,168 | 22,035 | 4,892 | 45,382 | 7,808 | 167,447 |
 |  | Income from private health insurance companies | 188,243 | 107,202 | 136,546 | 50,168 | 49,835 | 30,589 | 562,583 |
 |  | Income from third parties (c) | 4,271 | 1,192 | 1,442 | np | 958 | np | 9,022 |
 |  | Income direct from patient | 70,574 | 39,752 | 34,710 | 23,675 | 16,197 | 9,231 | 194,139 |
 |  | Total (d) | 315,844 | 189,066 | 197,132 | 80,485 | 114,217 | 51,383 | 948,127 |
 | Recoveries | 3,468 | 4,178 | 3,918 | np | 1,828 | np | 14,310 |
 | Other (e) | 9,251 | 9,707 | 2,196 | np | 1,211 | np | 28,467 |
 | Total (f) | 328,563 | 202,951 | 203,246 | 87,316 | 117,256 | 51,572 | 990,904 |
| Patient income as a proportion of total income (%) | 96.1 | 93.2 | 97.0 | 92.2 | 97.4 | 99.6 | 95.7 |
|
np not available for publication but included in totals where applicable, unless otherwise indicated
(a) Tasmania, the Northern Territory and the Australian Capital Territory have been aggregated to protect the confidentiality of the small number of hospitals in these states/territories.
(b) Includes income received by, and due to, the hospital in respect of patient liability for accommodation and other fees. See Glossary for further information.
(c) Includes, for example, payments Workcover payments, Motor Vehicle third party claims, workers compensation.
(d) Includes other patient income.
(e) Includes investment income, income from charities, bequests, visitors' meals, and accommodation and kiosk sales.
(f) Figures have been rounded and discrepancies may occur between totals and the sums of the component items. |
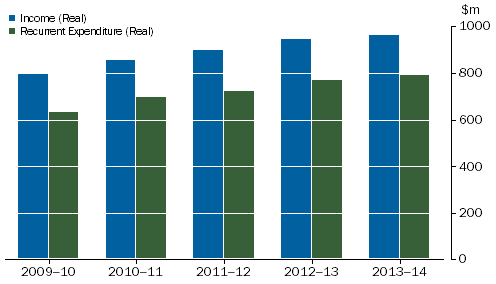
When income is adjusted to remove the effects of price changes over the period, the average annual increase over the five years from 2009-10 (total real income of $632 million) to 2013-14 (total real income of $964 million) was 3.9%. For further information on the use of chain volume measures to adjust income and expenditure, see Explanatory Note 26.
Private Free-standing Day Hospital Facilities, Real income and expenditure(a) 2009-10 to 2013-14
 (a) Laspeyres input cost index was used to provide real income and expenditure. See Explanatory Note 26 for further information.
|
|
 Print Page
 Print All
 Quality Declaration