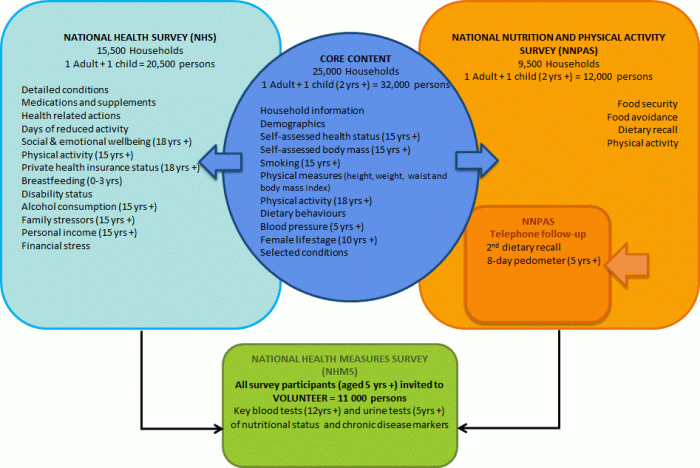
This publication summarises eating habits of Australians for each State and Territory. It presents results from a 24 hour dietary recall of foods and beverages from the 2011-12 National Nutrition and Physical Activity Survey (NNPAS). It contains general information on dietary behaviours, and consumption of selected foods and nutrients.
Foods consumed
How much food was consumed in Australia?
- In Australia, during 2011-12, people aged two years and over consumed an estimated 3.1 kilograms of foods and beverages (including water) per day, made up of a wide variety of foods. People from Victoria and Tasmania consumed the least (3kg) while those from the Northern Territory consumed the most (3.7kg).
Foods consumed
Nationally, 6% of people aged two years and over met the recommended usual daily intake of vegetables and 52% of people met the recommended usual daily intake of fruit.¹
- The proportion of people from each State and Territory who met the recommended usual daily intake of vegetables ranged between 9% in Tasmania and 5% in Queensland, the Northern Territory and the Australian Capital Territory (ACT).
- Those most likely to meet the recommendations for fruit were from the ACT and New South Wales (NSW) (54%) and least likely were from Tasmania (48%).
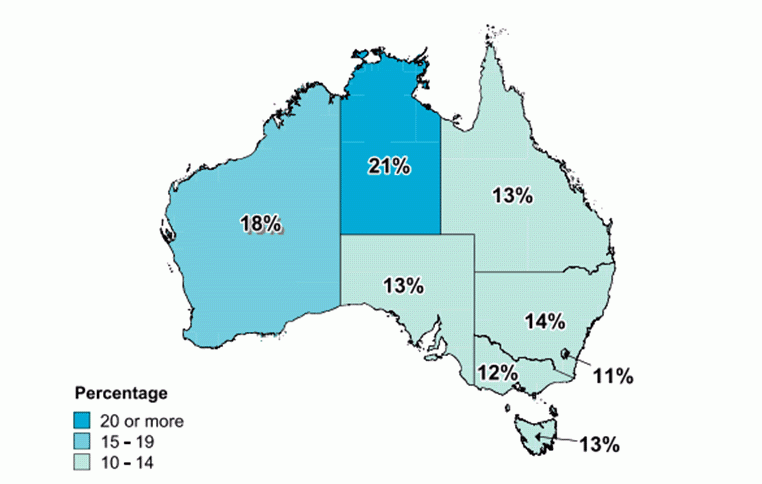
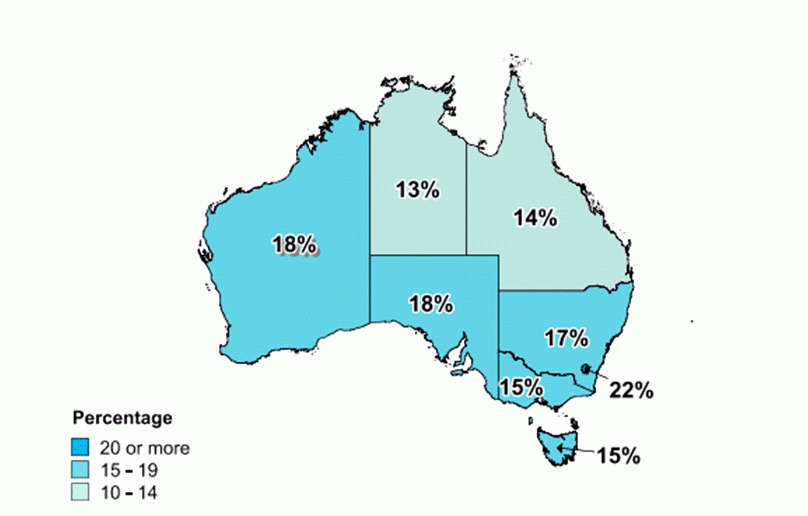
The following are selected food groups showing the State or Territory with the highest and lowest proportion of people consuming:
Non-alcoholic beverages
Fish and seafood products and dishes
Fruit products and dishes
Milk products and dishes
Vegetable products and dishes
Discretionary food
- Australians obtained over a third (35%) of their total energy from 'discretionary foods'.
- Canberrans obtained the least energy from 'discretionary foods' at one-third (33%) while Northern Territorians and Tasmanians obtained the most at 38%.
- Northern Territorian adults derived a higher proportion of their daily discretionary energy from alcoholic beverages when compared to all Australian adults (9% compared with 6%).
- Northern Territorians had the highest proportion of people who consumed 'soft drink' (33%) however they also had the lowest proportion of people of all the States and Territories who consumed 'confectionary' (20%), 'snack foods'(13%) and 'savoury biscuits' (12%).
- Tasmanians had the highest proportion of people consuming 'confectionary' (37%).
- People from NSW were most likely to report consuming 'snack foods' (16%).
- Victorians were most likely to report consuming 'savoury biscuits' (19%).
- Canberrans had the lowest proportion of people who reported drinking 'soft drink' (23%).
For more information see Table 5.1 for each State and Territory.
Energy and nutrients
Energy
- Men in all States and Territories had a similar average energy intake to the Australian average (9,954 kilojoules).
- Women in all States and Territories had a similar average energy intake to the Australian average at 7,420 kilojoules, with the exception of women in Tasmania who consumed more (7769kJ).
- The total energy intake is likely to be an under-estimate due to under-reporting.
- Similar in all States and Territories, carbohydrates contributed the largest proportion of total energy for Australians, supplying 45% on average with the balance of energy coming from fat (31%), protein (18%) and dietary fibre (2%). Alcohol also provided 4% of energy intake for adults in Australia. Each State and Territory was within the Acceptable Macronutrient Distribution Ranges (with the exception of SA and WA for carbohydrates) and within the National Health and Medical Research Council (NHMRC) recommended alcohol intake.
For more information see Table 1.1 and Table 2.1 for each State and Territory.
Selected macro and micro nutrients
Food avoidance
- In 2011-12, 17% of Australians aged two years or over reported avoiding a food due to allergy or intolerance.
- Around 7% of Australians avoided particular foods for cultural, religious or ethical reasons.
- Canberrans had the highest proportion of people avoiding a food due to allergy or intolerance (21%).
- Queensland had the lowest proportion avoiding particular foods for cultural, religious or ethical reasons (4%).
For more information see Table 6.1 for each State and Territory.
Food security
Nationally, 4.0% of people lived in a household that, in the previous 12 months, had run out of food and could not afford to buy more, and 1.5% of all Australians were in a household where someone went without food when they couldn't afford to buy any more. Rates were similar for all States and Territories. For more information see Table 7.1 for each State and Territory.
Further information
See Further information for definitions and more detailed explanations relating to this analysis.


