HOT WATER SYSTEMS
Almost all Queensland households (99.9% or 1,652,600) in October 2009 had a hot water system.
Energy source for hot water system
Of Queensland households that had a hot water system, 75% (1,233,400) used electricity as the energy source to heat it. Gas was used by 15% (240,600) of households as the energy source for their hot water system, and 8% (135,500) used solar energy (table 3.18).
Of the 135,500 households that used solar power for their hot water system, 91% (123,400) boosted it with electricity, while 5% (7,300) did not boost it at all (table 3.19).
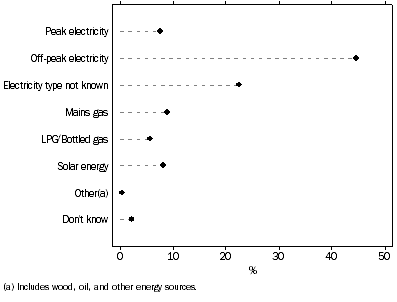
Almost half (45% or 736,400) of Queensland households with a hot water system used off-peak electricity to heat it, while only 8% (125,100) used peak electricity. There were 371,800 households (23%) that knew their hot water system used electricity, but did not know if it was peak or off-peak.
Mains gas was used by 9% (146,900) of Queensland households to heat their hot water system, while only 6% ( 93,700) used LPG/bottled gas (table 3.20).
Proportion of households, Energy source for hot water system
: Qld
- Oct. 2009

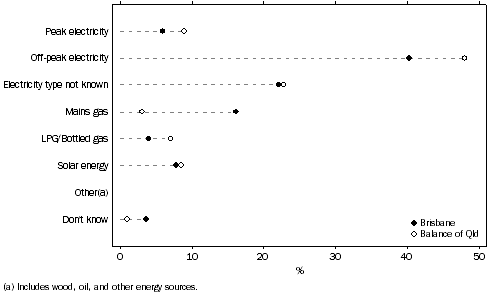
Of Brisbane households with a hot water system, electricity was used by 68% (497,900) as the hot water system energy source, compared to 80% (735,500) of households in the Balance of Queensland with a hot water system (table 3.18).
Mains gas was used to heat the hot water system in 16% (118,200) of Brisbane households with a hot water system, while for the Balance of Queensland the proportion was lower (3% or 28,800). For LPG/bottled gas, the proportions were 4% (29,300) and 7% (64,300) respectively (table 3.20).
Proportion of households, Energy source for hot water system
- Brisbane & Balance of Qld
- Oct. 2009

3.18 SOURCE OF ENERGY FOR HOT WATER SYSTEM, Households: Brisbane & Balance of Qld - Oct. 2009 |
|
 |  | Electricity | Gas | Solar energy | Other(a) | Energy source unknown | Total |
|
| Number ('000) |  |  |  |  |  |  |
 | Brisbane(b) | 497.9 | 147.5 | 57.0 | *1.9 | 26.1 | 730.4 |
 | Balance of Qld | 735.5 | 93.1 | 78.5 | *5.5 | *9.6 | 922.2 |
 | Total | 1 233.4 | 240.6 | 135.5 | *7.4 | 35.8 | 1 652.6 |
| Proportion (%) |  |  |  |  |  |  |
 | Brisbane(b) | 68.2 | 20.2 | 7.8 | *0.3 | 3.6 | 100.0 |
 | Balance of Qld | 79.8 | 10.1 | 8.5 | *0.6 | 1.0 | 100.0 |
 | Total | 74.6 | 14.6 | 8.2 | *0.4 | 2.2 | 100.0 |
|
| * estimate has a relative standard error of 25% to 50% and should be used with caution |
| (a) Includes wood, oil and other energy sources. |
| (b) Refers to the Brisbane Major Statistical Region. |
 |
3.19 TYPE OF BOOSTER FOR SOLAR HOT WATER SYSTEM, Households: Qld - Oct. 2009 |
|
 | Electric | Gas(a) | Other | Not boosted | Total(b) |
|
| Number ('000) | 123.4 | np | np | 7.3 | 135.5 |
| Proportion (%) | 91.1 | np | np | 5.4 | 100.0 |
|
| np not available for publication but included in totals where applicable, unless otherwise indicated |
| (a) Includes mains and bottled gas. |
| (b) Includes booster type not known. |
3.20 SOURCE OF ENERGY FOR HOT WATER SYSTEM, Households: Brisbane & Balance of Qld - Oct. 2009 |
|
 |  | Peak
electricity | Off-peak
electricity | Electricity type
unknown | Mains
gas | LPG/
Bottled gas | Solar
energy | Other(a) | Energy source unknown | Total |
|
| Number ('000) |  |  |  |  |  |  |  |  |  |
 | Brisbane(b) | 43.2 | 293.3 | 161.3 | 118.2 | 29.3 | 57.0 | *1.9 | 26.1 | 730.4 |
 | Balance of Qld | 81.9 | 443.1 | 210.5 | 28.8 | 64.3 | 78.5 | *5.5 | *9.6 | 922.2 |
 | Total | 125.1 | 736.4 | 371.8 | 146.9 | 93.7 | 135.5 | *7.4 | 35.8 | 1 652.6 |
| Proportion (%) |  |  |  |  |  |  |  |  |  |
 | Brisbane(b) | 5.9 | 40.2 | 22.1 | 16.2 | 4.0 | 7.8 | *0.3 | 3.6 | 100.0 |
 | Balance of Qld | 8.9 | 48.0 | 22.8 | 3.1 | 7.0 | 8.5 | *0.6 | 1.0 | 100.0 |
 | Total | 7.6 | 44.6 | 22.5 | 8.9 | 5.7 | 8.2 | *0.4 | 2.2 | 100.0 |
|
| * estimate has a relative standard error of 25% to 50% and should be used with caution |
| (a) Includes wood, oil, and other energy sources. |
| (b) Refers to the Brisbane Major Statistical Region. |
 Print Page
 Print All