WHITEGOODS
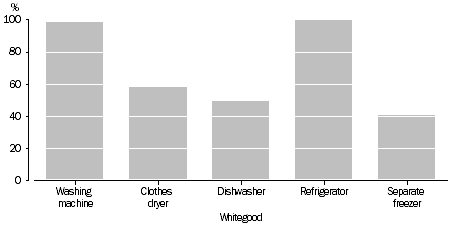
In October 2009, almost all of the 1,654,000 households in Queensland had a refrigerator (99.6% or 1,647,600 households) and a washing machine (98.5% or 1,629,600). Half (50%) of all Queensland households (821,200) had a dishwasher and 58% (957,800) had a clothes dryer. There were 41% (672,700) of Queensland households that had a separate freezer (table 3.1).
PROPORTION OF HOUSEHOLDS, Type of whitegood
: Qld
- Oct. 2009
Selected whitegoods by household characteristics
Tenure type
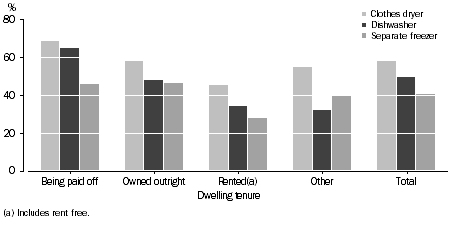
In Queensland in October 2009 there were 586,500 households in owner occupied dwellings which were being paid off. Of these, 69% (402,400) had a clothes dryer, 65% (380,900) had a dishwasher and 46% (269,900) had a separate freezer. Of the 550,300 households which owned the dwelling outright, 58% (318,400) had a clothes dryer, 48% (264,700) had a dishwasher and 46% (255,300) had a separate freezer. There were 486,200 households in dwellings being rented in Queensland in October 2009 with 45% (220,000) having a clothes dryer, 34% (165,600) having a dishwasher and 28% (135,000) having a separate freezer (table 3.1).
Proportion of households, Tenure type
- Selected whitegoods
: Qld
- Oct. 2009
Annual household income
In October 2009, Queensland households with an annual income of $110,000 or more per year, were more likely to have a clothes dryer and/or a dishwasher than households with an annual income of less than $25,000 per year.
Only 39% (128,700) of Queensland households that reported an annual household income of less than $25,000 per year had a clothes dryer. In comparison, 75% (202,400) of households with the highest income level ($110,000 or more per year) had a clothes dryer.
About one quarter (24% or 77,300) of Queensland households with an annual household income of less than $25,000 per year had a dishwasher, while about three quarters (75% or 203,400) of households with the highest income level ($110,000 or more per year) had a dishwasher (table 3.2).
Selected characteristics of whitegoods
Washing machine
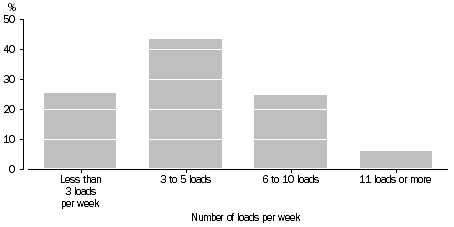
In October 2009, almost all households in Queensland had a washing machine (99% or 1,629,600). The majority of these households (69% or 1,122,200) averaged five or less loads of washing per week, with 31% (500,600) averaging more than five loads per week (table 3.3).
Proportion of households, Number of washing loads
: Qld
- Oct. 2009
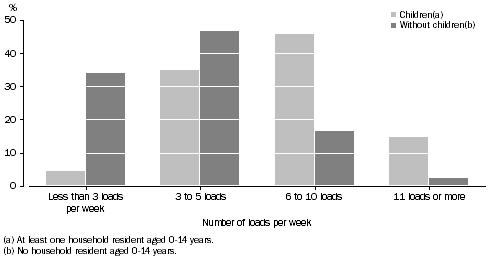
Households with children aged under 15 years were more likely to do more loads of washing than other households. Of the 468,600 households with a washing machine and at least one child aged under 15 years, 60% (282,800) averaged more than five loads of washing per week. (table 3.3).
Proportion of households, Number of washing loads
- Whether any children aged under 15 years in household
: Qld
- Oct. 2009
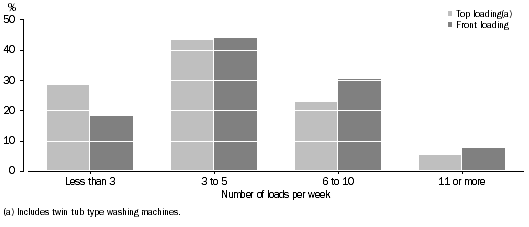
Of the 1,629,600 households that had a washing machine, 27% (447,500) used a front loading machine and 73% (1,182,100) used a top loading machine (including twin tubs). The most common number of washing loads for both front loading and top loading machines was three to five loads per week, 44% (195,500) and 43% (510,600) respectively.
For households with a top loading washing machine, 28% (331,100) did more than five loads per week. In comparison, of the 447,500 households that used a front loading washing machine, 38% (169,400) did more than five loads per week (table 3.4).
Proportion of households, Number of washing loads
- Type of washing machine
: Qld
- Oct. 2009
Clothes dryer
In October 2009, 58% (957,800) of all households in Queensland had a clothes dryer. Of these, 26% (247,400) used their clothes dryer at least once a week. About half (50% or 476,900) did not have a regular frequency of use and reported the use of their clothes dryer depended on the weather or season. Of all households that had a clothes dryer, about one in ten (10% or 93,000) never used it.
Households without children aged under 15 years were more likely to never use their clothes dryer (12% or 75,700) than households that had children aged under 15 years (5% or 17,300) (table 3.5).
Dishwasher
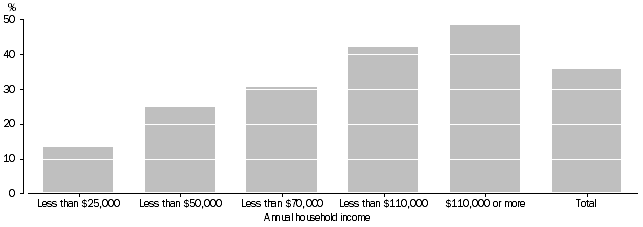
There were 821,200 Queensland households that had a dishwasher in October 2009, which represented 50% of total households. Of the households with a dishwasher, 36% (292,400) used it daily and a further 28% (231,100) used it three or more times a week, but not daily. More than one in ten households with a dishwasher (13% or 106,000) reported they never used it.
Of households with a dishwasher, those with children aged under 15 years were more likely than those without children aged under 15 years to use it daily. The proportion of households with children aged under 15 years that used their dishwasher daily (58% or 162,200) was more than twice the proportion of households without children aged under 15 years that used it daily (24% or 130,200) (table 3.6).
Of households receiving less than $25,000 household income per year that had a dishwasher, 13% (10,300) used it daily, while 28% (21,300) reported they never used it. In comparison, 48% (98,500) of households receiving $110,000 or more per year that had a dishwasher reported they used it daily, while 8% (16,500) never used it (table 3.7).
Proportion of Households, Daily dishwasher use, Annual household income
: Qld
- Oct. 2009
Refrigerator
In October 2009, almost all households in Queensland (99.6% or 1,647,600) had at least one refrigerator (table 3.1).
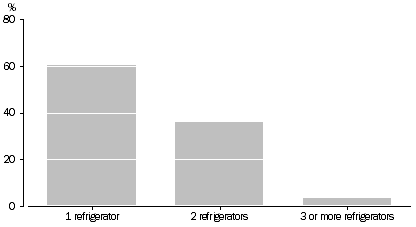
There were 998,500 households (60%) that had one refrigerator only, 593,100 households (36%) which had two refrigerators and a further 56,000 households (3%) with three or more refrigerators (table 3.8).
Proportion of households, Refrigerators used
: Qld
- Oct. 2009
Age of main and second refrigerator
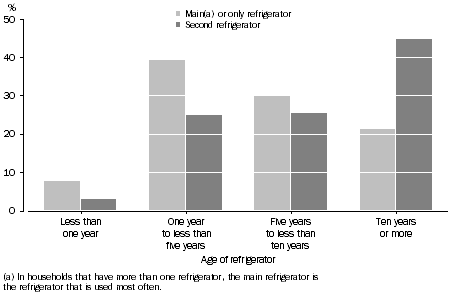
In October 2009, there were 648,800 (39%) Queensland households that reported the age of their main, or only, refrigerator was one year to less than five years. A further 30% (494,200) reported the age of their main refrigerator was five years to less than ten years, while 21% (349,600) reported it was aged ten years or more. The remaining 8% (125,100) reported their main refrigerator to be less than one year old (table 3.9).
In comparison with the age of second refrigerators, of the 649,100 households that had two or more refrigerators, 45% (290,600) reported the age of their second refrigerator was ten years or more. There were 25% (164,700) that reported their second refrigerator was aged five years to less than ten years and a further 25% (162,200) reported it was aged one year to less than five years. The remaining 3% (19,200) reported their second refrigerator was less than one year old (table 3.10).
Proportion of households with main or second refrigerator, Age of refrigerator
: Qld
- Oct. 2009
Separate freezer
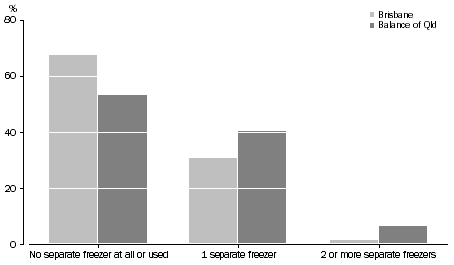
The survey asked if the household used any separate freezers apart from the freezer compartment in a refrigerator. In October 2009, there were 599,400 households that used one separate freezer, representing 36% of all Queensland households, while only 4% (71,000) used two or more separate freezers. The remaining 60% (983,700) of households either did not use their separate freezer or did not have one.
In Brisbane, 31% (225,400) of households used one separate freezer, while 2% (12,500) used two or more. In comparison, for the balance of Queensland, 41% (374,000) used one separate freezer and 6% (58,400) used two or more (table 3.11).
Proportion of households, Number of separate freezers
- Brisbane and Balance of Qld
- Oct. 2009
3.1 HOUSEHOLDS, Type of whitegood - Tenure type: Qld - Oct. 2009 |
|
 |  | Washing
machine | Clothes
dryer | Dishwasher | Refrigerator | Separate
freezer | Total households
(a)(b) |
|
| Number ('000) |  |  |  |  |  |  |
 | Being paid off | 582.7 | 402.4 | 380.9 | 585.1 | 269.9 | 586.5 |
 | Owned outright | 547.5 | 318.4 | 264.7 | 548.9 | 255.3 | 550.3 |
 | Rented(c) | 469.8 | 220.0 | 165.6 | 483.5 | 135.0 | 486.2 |
 | Other | 29.6 | 17.0 | 10.0 | 30.1 | 12.5 | 31.0 |
 | Total | 1 629.6 | 957.8 | 821.2 | 1 647.6 | 672.7 | 1 654.0 |
| Proportion (%) |  |  |  |  |  |  |
 | Being paid off | 99.3 | 68.6 | 64.9 | 99.8 | 46.0 | 100.0 |
 | Owned outright | 99.5 | 57.9 | 48.1 | 99.7 | 46.4 | 100.0 |
 | Rented(c) | 96.6 | 45.3 | 34.1 | 99.4 | 27.8 | 100.0 |
 | Other | 95.6 | 54.9 | 32.2 | 97.1 | 40.3 | 100.0 |
 | Total | 98.5 | 57.9 | 49.6 | 99.6 | 40.7 | 100.0 |
|
| (a) Includes households that had none of these whitegoods. |
| (b) May not add to sum of components as households may have more than one whitegood. |
| (c) Includes rent free |
3.2 HOUSEHOLDS, Type of whitegood - Annual household income: Qld - Oct. 2009 |
|
 |  | Washing
machine | Clothes
dryer | Dishwasher | Refrigerator | Separate
freezer | Total households
(a)(b) |
|
| Number ('000) |  |  |  |  |  |  |
 | Less than $25,000 | 314.5 | 128.7 | 77.3 | 324.9 | 119.6 | 327.6 |
 | $25,000 to less than $50,000 | 371.1 | 199.0 | 150.9 | 375.0 | 162.7 | 376.3 |
 | $50,000 to less than $70,000 | 255.1 | 157.4 | 140.0 | 257.8 | 100.5 | 258.8 |
 | $70,000 to less than $110,000 | 351.5 | 232.9 | 215.0 | 351.1 | 150.7 | 352.0 |
 | $110,000 or more | 271.6 | 202.4 | 203.4 | 271.1 | 115.5 | 271.6 |
 | Total(c) | 1 629.6 | 957.8 | 821.2 | 1 647.6 | 672.7 | 1 654.0 |
| Proportion (%) |  |  |  |  |  |  |
 | Less than $25,000 | 96.0 | 39.3 | 23.6 | 99.2 | 36.5 | 100.0 |
 | $25,000 to less than $50,000 | 98.6 | 52.9 | 40.1 | 99.6 | 43.2 | 100.0 |
 | $50,000 to less than $70,000 | 98.6 | 60.8 | 54.1 | 99.6 | 38.8 | 100.0 |
 | $70,000 to less than $110,000 | 99.9 | 66.2 | 61.1 | 99.7 | 42.8 | 100.0 |
 | $110,000 or more | 100.0 | 74.5 | 74.9 | 99.8 | 42.5 | 100.0 |
 | Total(c) | 98.5 | 57.9 | 49.6 | 99.6 | 40.7 | 100.0 |
|
| (a) Includes households that had none of these whitegoods. |
| (b) May not add to sum of components as households may have more than one whitegood. |
| (c) Includes households with no income, amount of regular income not known and refusals. |
3.3 HOUSEHOLDS WITH WASHING MACHINE, Number of washing loads per week -
Whether children aged under 15 years in the household: Qld - Oct. 2009 |
|
 |  | Less than 3 loads
per week | 3 to 5 loads | 6 to 10 loads | 11 loads or more | Total(a) |
|
| Number ('000) |  |  |  |  |  |
 | Children(b) | 21.4 | 163.3 | 214.4 | 68.4 | 468.6 |
 | Without children(c) | 394.6 | 542.9 | 191.4 | 26.5 | 1 161.0 |
 | Total | 416.1 | 706.2 | 405.8 | 94.9 | 1 629.6 |
| Proportion (%) |  |  |  |  |  |
 | Children(b) | 4.6 | 34.9 | 45.8 | 14.6 | 100.0 |
 | Without children(c) | 34.0 | 46.8 | 16.5 | 2.3 | 100.0 |
 | Total | 25.5 | 43.3 | 24.9 | 5.8 | 100.0 |
|
| (a) Includes households with number of loads not known. |
| (b) At least one household resident aged 0-14 years, See Glossary for definition of 'Children under the age of 15 years'. |
| (c) No household resident aged 0-14 years See Glossary for definition of 'Children under the age of 15 years'. |
3.4 HOUSEHOLDS WITH WASHING MACHINE, Number of washing loads per week - Type of washing machine: Qld - Oct. 2009 |
|
 |  | Less than 3 loads | 3 to 5 loads | 6 to 10 loads | 11 loads or more | Total(a) |
|
| Number ('000) |  |  |  |  |  |
 | Top loading(b) | 335.9 | 510.6 | 269.5 | 61.6 | 1 182.1 |
 | Front loading | 80.1 | 195.5 | 136.2 | 33.2 | 447.5 |
 | Total | 416.1 | 706.2 | 405.8 | 94.9 | 1 629.6 |
| Proportion (%) |  |  |  |  |  |
 | Top loading(b) | 28.4 | 43.2 | 22.8 | 5.2 | 100.0 |
 | Front loading | 17.9 | 43.7 | 30.4 | 7.4 | 100.0 |
 | Total | 25.5 | 43.3 | 24.9 | 5.8 | 100.0 |
|
| (a) Includes households with number of loads not known. |
| (b) Includes twin tub type washing machines. |
3.5 HOUSEHOLDS WITH CLOTHES DRYER, Frequency of clothes dryer use -
Whether children aged under 15 years in the household: Qld - Oct. 2009 |
|
 |  | At least once a week | At least
once a fortnight | At least
once a month | Less than
one month | Depends on
the weather/season | Never | Total |
|
| Number ('000) |  |  |  |  |  |  |  |
 | Children(a) | 96.1 | 17.2 | 20.7 | 13.6 | 159.5 | 17.3 | 324.4 |
 | Without children(b) | 151.2 | 23.1 | 25.4 | 40.5 | 317.4 | 75.7 | 633.3 |
 | Total | 247.4 | 40.3 | 46.1 | 54.2 | 476.9 | 93.0 | 957.8 |
| Proportion (%) |  |  |  |  |  |  |  |
 | Children(a) | 29.6 | 5.3 | 6.4 | 4.2 | 49.2 | 5.3 | 100.0 |
 | Without children(b) | 23.9 | 3.6 | 4.0 | 6.4 | 50.1 | 12.0 | 100.0 |
 | Total | 25.8 | 4.2 | 4.8 | 5.7 | 49.8 | 9.7 | 100.0 |
|
| (a) At least one household resident aged 0-14 years. See Glossary for definition of 'Children under the age of 15 years'. |
| (b) No household resident aged 0-14 years. See Glossary for definition of 'Children under the age of 15 years'. |
3.6 HOUSEHOLDS WITH DISHWASHER, Frequency of dishwasher use - Whether children aged under 15 years in the household: Qld - Oct. 2009 |
|
 |  | Daily | Three or more times a week
(but not daily) | Once or twice
a week | Less often than
once a week | Never | Total(a) |
|
| Number ('000) |  |  |  |  |  |  |
 | Children(b) | 162.2 | 64.1 | 16.4 | 13.9 | 24.5 | 281.2 |
 | Without children(c) | 130.2 | 166.9 | 100.3 | 59.0 | 81.5 | 540.0 |
 | Total | 292.4 | 231.1 | 116.7 | 73.0 | 106.0 | 821.2 |
| Proportion (%) |  |  |  |  |  |  |
 | Children(b) | 57.7 | 22.8 | 5.8 | 5.0 | 8.7 | 100.0 |
 | Without children(c) | 24.1 | 30.9 | 18.6 | 10.9 | 15.1 | 100.0 |
 | Total | 35.6 | 28.1 | 14.2 | 8.9 | 12.9 | 100.0 |
|
| (a) Includes frequency of use not known. |
| (b) At least one household resident aged 0-14 years. See Glossary for definition of 'Children under the age of 15 years'. |
| (c) No household resident aged 0-14 years. See Glossary for definition of 'Children under the age of 15 years'. |
3.7 HOUSEHOLDS WITH DISHWASHER, Frequency of dishwasher use - Annual household income: Qld - Oct. 2009 |
|
 |  | Daily | Three or more times a week
(but not daily) | Once or twice
a week | Less often than
once a week | Never | Total(a) |
|
| Number ('000) |  |  |  |  |  |  |
 | Less than $25,000 | 10.3 | 16.7 | 16.2 | 12.3 | 21.3 | 77.3 |
 | $25,000 to less than $50,000 | 37.4 | 46.2 | 28.7 | 16.2 | 22.4 | 150.9 |
 | $50,000 to less than $70,000 | 42.8 | 42.7 | 20.5 | 13.2 | 20.7 | 140.0 |
 | $70,000 to less than $110,000 | 90.1 | 63.3 | 24.9 | 16.3 | 20.3 | 215.0 |
 | $110,000 or more | 98.5 | 56.2 | 19.7 | 11.0 | 16.5 | 203.4 |
 | Total(b) | 292.4 | 231.0 | 116.7 | 73.0 | 106.0 | 821.2 |
| Proportion (%) |  |  |  |  |  |  |
 | Less than $25,000 | 13.3 | 21.6 | 21.0 | 15.9 | 27.6 | 100.0 |
 | $25,000 to less than $50,000 | 24.8 | 30.6 | 19.0 | 10.7 | 14.8 | 100.0 |
 | $50,000 to less than $70,000 | 30.6 | 30.5 | 14.7 | 9.5 | 14.8 | 100.0 |
 | $70,000 to less than $110,000 | 41.9 | 29.5 | 11.6 | 7.6 | 9.5 | 100.0 |
 | $110,000 or more | 48.4 | 27.6 | 9.7 | 5.4 | 8.1 | 100.0 |
 | Total(b) | 35.6 | 28.1 | 14.2 | 8.9 | 12.9 | 100.0 |
|
| (a) Includes frequency of use not known. |
| (b) Includes households with no income, amount of regular income not known and refusals. |
3.8 HOUSEHOLDS, Refrigerators used: Qld - Oct. 2009 |
|
 | One refrigerator | Two refrigerators | Three or more refrigerators | No refrigerator | Total |
|
| Number ('000) | 998.5 | 593.1 | 56.0 | *6.4 | 1 654.0 |
| Proportion (%) | 60.4 | 35.9 | 3.4 | *0.4 | 100.0 |
|
| * estimate has a relative standard error of 25% to 50% and should be used with caution |
3.9 HOUSEHOLDS WITH REFRIGERATOR, Age of main refrigerator: Qld - Oct. 2009 |
|
 | Less than one year | One year to
less than five years | Five years to
less than ten years | Ten years or more | Total(a) |
|
| Number ('000) | 125.1 | 648.8 | 494.2 | 349.6 | 1 647.6 |
| Proportion (%) | 7.6 | 39.4 | 30.0 | 21.2 | 100.0 |
|
| (a) Includes age of main refrigerator not known. |
3.10 HOUSEHOLDS WITH SECOND REFRIGERATOR, Age of second refrigerator: Qld - Oct. 2009 |
|
 | Less than one year | One year to
less than five years | Five years to
less than ten years | Ten years or more | Don't know | Total |
|
| Number ('000) | 19.2 | 162.2 | 164.7 | 290.6 | 12.4 | 649.1 |
| Proportion (%) | 3.0 | 25.0 | 25.4 | 44.8 | 1.9 | 100.0 |
|
3.11 HOUSEHOLDS, Separate freezers used: Brisbane(a) and Balance of Qld - Oct. 2009 |
|
 |  | No separate freezers
at all or used | One separate freezer | Two or more
separate freezers | Total |
|
| Number ('000) |  |  |  |  |
 | Brisbane(a) | 493.0 | 225.4 | 12.5 | 730.9 |
 | Balance of Queensland | 490.7 | 374.0 | 58.4 | 923.2 |
 | Total | 983.7 | 599.4 | 71.0 | 1 654.0 |
| Proportion (%) |  |  |  |  |
 | Brisbane(a) | 67.5 | 30.8 | 1.7 | 100.0 |
 | Balance of Queensland | 53.2 | 40.5 | 6.3 | 100.0 |
 | Total | 59.5 | 36.2 | 4.3 | 100.0 |
|
| (a) Refers to the Brisbane Major Statistical Region. |
 Quality Declaration
  Print Page
 Print All