INTRODUCTION
This chapter presents information on the household and family living arrangements of Aboriginal and Torres Strait Islander peoples as recorded in the Census. It focuses on households in which at least one Indigenous person, of any age, was resident on Census night and who was a usual resident of the household. Discussion of people in this chapter is based only on people enumerated at home, and excludes visitors.
In the Census, a household is defined as one or more persons, at least one of whom is at least 15 years of age, usually resident in the same private dwelling. See Glossary for more detail.
In this publication, households are separated into those containing at least one Indigenous person (referred to as Indigenous households) and other households where there are no identified Indigenous person(s) present. Both types may be further classified as family, group or lone person households.
The household and family structures adopted for reporting Census results may not always fully reflect the richness and complexity of household and family relationships relevant to the Indigenous population, but do provide a comparison with household composition for the non-Indigenous population. For this reason they have been retained.
Proportions presented in this chapter exclude not stated responses, and are therefore calculated using only known responses. Where possible, the numbers of unknown responses are noted in the tables, allowing further analysis if required.
HOUSEHOLD COMPOSITION
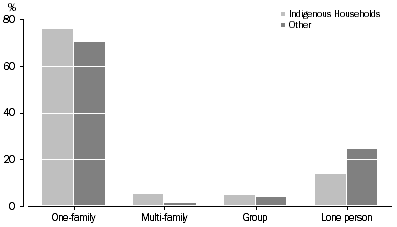
Household composition for Indigenous households is based on all usual residents present, including non-Indigenous people. The more common types of living arrangements recorded in Indigenous households are illustrated in the following diagram.
At the time of the 2006 Census, Indigenous households were more likely than other households to be family households (81% compared with 68%) and less likely to be lone person households (14% compared with 23%). Among Indigenous households, 5% were multi-family households, compared with 1% for other households.
Household Composition
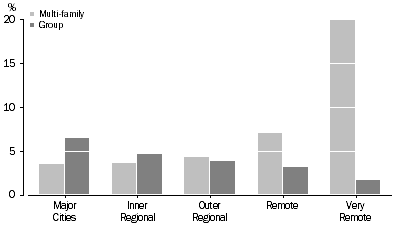
Living arrangements varied with geographic remoteness. Among Indigenous households, multi-family households were most common in Very Remote areas where 20% were multi-family. In comparison, multi-family other households were most common in Major Cities, however this accounted for only 1% of all household types.
The picture for group households was reversed, with the proportion of group Indigenous households at 6% in Major Cities to less than 2% in Very Remote areas. For other group households, there was less variation in the proportions; they varied between 2%-4% across levels of remoteness.
Multi-family and group households by Remoteness Areas, Indigenous households
FAMILY COMPOSITION
One-family Indigenous households were three times more likely than other one-family households to be one-parent families with dependants (30% and 10%, respectively), less likely to be families without dependants (about 33% and 53%, respectively) and equally likely to be couples with dependent children (about 37%).
Family Composition, Selected family types(a)
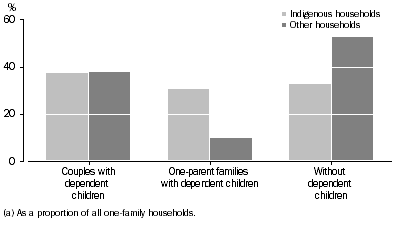
Among one-family Indigenous households, the proportion that were couples with dependent children rose with increasing remoteness from 34% in Major Cities to 47% in Very Remote areas. In comparison, the proportion of other one-family households that were couples with dependent children was fairly even across all levels of remoteness (between 37% and 40%). Within one-family Indigenous households, however, one-parent families were most highly represented in Major Cities and regional areas (32%) and least represented in Very Remote areas (21%), similar to the pattern for other household one-parent families (10% compared with 5%). Families without dependent children were fairly evenly represented across both urban and remote areas, regardless of whether or not they had Indigenous residents.
HOUSEHOLD SIZE
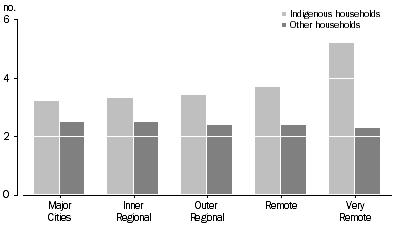
Indigenous households tended to be larger than other households (average of 3.3 persons per household, compared with 2.5, respectively). One of the major factors contributing to this difference is the higher number of dependent children in Indigenous households - for all Indigenous family types the average number of dependent children was 1.1, compared with 0.5 for other households.
The largest households were those with two or more families (multi-family households). Multi-family Indigenous households had an average of 7.0 persons, compared with 5.3 persons in other multi-family households.
For Indigenous households, household size tended to rise with increasing remoteness, from an average of 3.1 persons per household in Major Cities to 4.9 in Very Remote areas. For other households, the household size was similar for all levels of remoteness.
Average Number of Residents by Remoteness Areas
RELATIONSHIP IN HOUSEHOLD
Information on the relationships among people in a household complements information on household type. Care should be taken when interpreting this information as the standard Census relationship classifications used here may not fully represent the complexity of family relationships in Aboriginal and Torres Strait Islander cultures.
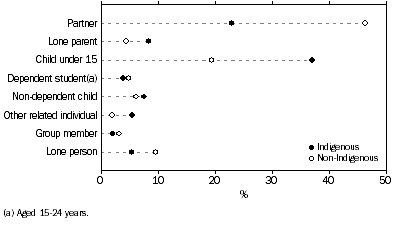
Differences between Indigenous people and non-Indigenous people in the representation of household relationships reflect differences in the age structure of the two populations. For example, the high proportion of children in the Indigenous population results in smaller proportions of the various types of adult relationships in Indigenous households when compared with other households.
Over a third of Indigenous people (39%) living in occupied private dwellings at the time of the 2006 Census were children under 15 years, about twice the proportion of the non-Indigenous population (20%).
Indigenous people were half as likely as non-Indigenous people to be classified as a spouse/partner in a couple relationship (24% compared with 48%, respectively) and twice as likely to be classified as a lone parent (9% compared with nearly 5%, respectively).
Indigenous people were three times more likely than non-Indigenous people to be classified as extended family members (other related individuals) living with relatives other than their spouse/partner or children (6% and 2% respectively). The proportion of Indigenous people classified as other related individuals rose with increasing geographic remoteness, from almost 4% in Major Cities and regional areas to 14% in Very Remote areas.
Relationship in Household
 Print Page
 Print All