INCOME
Free-standing day hospital facilities received $876 million in income during 2011-12, a 7.8% increase from 2010-11. Free-standing day hospitals received 95.7% of their total revenue as patient revenue in 2011-12, up from 94.9% in 2010-11.
The proportion of total income received as patient income varied from 93.3% of all income in Plastic and cosmetic surgery centres to 98.5% of all income in Ophthalmic surgery hospitals .
The average income per Free-standing day hospital in 2011-12 was $2.815 million. This varied from $1.629 million per Plastic and cosmetic surgery establishment to $3.860 million per Ophthalmic surgery hospital.
Table 3.6 PRIVATE FREE-STANDING DAY HOSPITALS, Income—Type of centre(a) —2011-12
|
 |  | Gastroenterology (b) | Ophthalmic surgery | Plastic and cosmetic surgery | Gynaecology, Fertility treatment and Family Planning | Other(c) | Total(d) |
|
| Income ($'000) |  |  |  |  |  |  |
 | Patient income(e) | 159 023 | 247 180 | 48 644 | 79 272 | 303 920 | 838 039 |
 | Recoveries | 6 287 | 2 963 | 2 305 | np | np | 13 718 |
 | Other (f) | 4 649 | 779 | 1 193 | np | np | 23 821 |
 | Total (g) | 169 959 | 250 922 | 52 142 | 82 422 | 320 133 | 875 578 |
| Patient income as a proportion of total income (%) | 93.6 | 98.5 | 93.3 | 96.2 | 94.9 | 95.7 |
|
np not available for publication but included in totals where applicable, unless otherwise indicated
(a) See Explanatory Note 25 for further information on categories.
(b) Gastroenterology, including endoscopy.
(c) Including Dental Oral Maxillofacial surgery, Dialysis, Oncology, General surgery, sleep disorders clinic and other types of centre.
(d) Figures have been rounded and discrepancies may occur between totals and the sums of the component items.
(e) Includes income received by, and due to, the hospital in respect of patient liability for accommodation and other fees. See Glossary for further information.
(f) Include income from workers compensation payments, motor vehicle third party claims.
(g) Including investment income, income from charities, bequests, visitors' meals, and accommodation and kiosk sales. |
NSW recorded the highest proportion of all Free-standing day hospital income at 33.8%. Income per hospital ranged from $2.305 million in Victoria to $3.298 million in Queensland, while patient income as a proportion of total income ranged from 91.9% in Victoria to 98.6% in the smaller states.
Table 3.7 PRIVATE FREE-STANDING DAY HOSPITALS, Income—States and territories —2011-12
|
 |  | NSW | Vic. | Qld | SA | WA | Tas., NT & ACT(a) | Aus. |
|
| Income ($'000) |  |  |  |  |  |  |  |
 | Patient income(b) | 285 163 | 180 112 | 170 958 | 58 812 | 95 437 | 47 557 | 838 039 |
 | Recoveries | 4 248 | 5 351 | 1 544 | np | np | 342 | 13 718 |
 | Other (c) | 6 484 | 10 446 | 2 280 | np | np | 333 | 23 821 |
 | Total (d) | 295 895 | 195 909 | 174 782 | 63 220 | 97 540 | 48 232 | 875 578 |
| Patient income as a proportion of total income (%) | 96.4 | 91.9 | 97.8 | 93.0 | 97.8 | 98.6 | 95.7 |
|
np not available for publication but included in totals where applicable, unless otherwise indicated
(a) Tasmania, the Northern Territory and the Australian Capital Territory have been aggregated to protect the confidentiality of the small number of hospitals in these states/territories.
(b) Includes income received by, and due to, the hospital in respect of patient liability for accommodation and other fees. See Glossary for further information.
(c) Including investment income, income from charities, bequests, visitors' meals, and accommodation and kiosk sales.
(d) Figures have been rounded and discrepancies may occur between totals and the sums of the component items. |
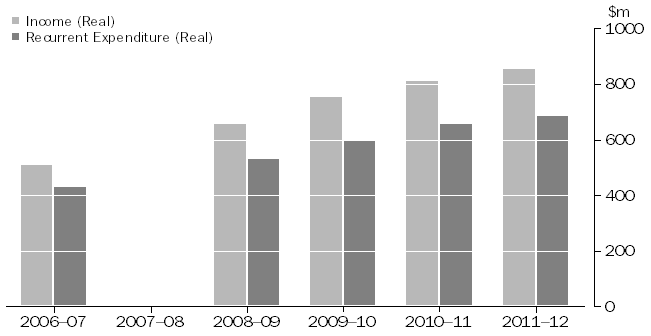
When income is adjusted to remove the effects of price changes over the period, the average annual increase over the five years from 2006-07 ($511 million) to 2011-12 ($855 million) was 10.8%. For further information on the use of chain volume measures to adjust income and expenditure, see
Explanatory Note 26.
Private Free-standing Day Hospital Facilities, Real income and expenditure(a)
2006-07 to 2011-12(b)
 (a) Laspeyres input cost index was used to provide real income and expenditure. See Explanatory Note 26 for further information.
(b) Data for 2007–08 reference year are not available. See Explanatory Note 4 for further information.
 Quality Declaration
  Print Page
 Print All