PUBLIC TRANSPORT
Public transportation can play an important role in the economic, social and environmental outcomes of a city (BITRE 2009, Dodson et al 2011).
At an economic level, growing cities like Melbourne experience the 'positive' benefits of agglomeration economies. Businesses can access a more extensive customer base and labour market, leading to increased workforce specialisation, better matching of jobs with worker preferences and increased economic performance. These benefits are balanced against the 'negative' outcomes of a growing city: crowding, congestion, higher operating costs, and pollution. These 'negative' outcomes are known as agglomeration dis-economies (DoT 2012).
A public transportation network can play a substantial role in maximising the positive benefits of agglomeration while mitigating against the negatives by allowing a greater number of people to access geographically distant labour markets and reducing transportation costs (DoT 2012).
Public transport can positively influence the social outcomes in a city for people most at risk of social isolation — low-income earners, the unemployed, the elderly and people with a disability by providing easier access to employment, education, and health and community services (TTF 2010).
In terms of environmental outcomes, the public transport network can help mitigate against carbon emissions to the atmosphere by allowing people to make use of more sustainable forms of transport (DoT 2012a).
In response to these economic, environmental and social issues, Infrastructure Australia has identified public transport networks as critical to the long-term success of Australian cities (IA 2011). The Victorian Department of Transport recognises that understanding the trends and pressures facing the transport system is key to the effective delivery of services.
This survey presents demographic data on public transport users in Melbourne, and information on their frequency of use and the main reasons for using (or not using) public transport.
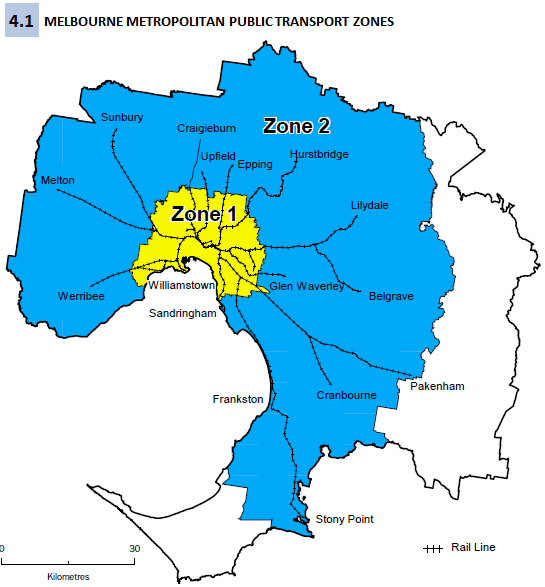
Melbourne’s public transport network is divided into two main zones1. Melbourne Metropolitan Public Transport Zone 1 (Zone 1) cover the city centre and most of the inner suburbs or Melbourne, while Melbourne Metropolitan Public Transport Zone 2 (Zone 2) covers most of the outer suburbs (Figure 4.1).

PERSONS WHO USED PUBLIC TRANSPORT IN THE LAST MONTH
Of the 3.1 million people living in Zones 1 and 2, 1.2 million (38%) used public transport in the last month. Just under half (585,300) of these public transport patrons lived in Zone 1, representing 57% of the total Zone 1 population (1.0 million). The remaining 609,100 public transport patrons lived in Zone 2, representing 29% of the total Zone 2 population— proportionally less than in Zone 1.
In 2009, 55% (567,000) of the Zone 1 population and 28% (557,800) of the Zone 2 population used public transport in the last month.
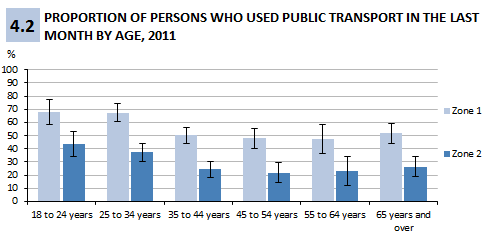
In 2011, persons in the two younger age groups in Zone 1 were more likely than persons in the three older age groups to have used public transport in the last month (Figure 4.2). A third of persons aged 18 to 24 years (68% or 95,600), and 25 to 34 years (67% or 184,600) used public transport in the last month.
Half the persons aged 35 to 44 years (50% or 98,600), 45 to 54 years (48% or 80,800), 55 to 64 years (48% or 57,200), and 65 years and over (52% or 68,400) used public transport.
Similarly in Zone 2, users in the two younger age groups were more likely than their older counterparts to have used public transport in the last month (Figure 4.2). Under half the persons aged 18 to 24 years (44% or 126,000), and a third of persons aged 25 to 34 years (37% or 144,700) used public transport.
A quarter of persons aged 35 to 44 years (24% or 98,300), one in five persons aged 45 to 54 years (22% or 79,900), and a quarter of persons 23% aged 55 to 64 years (23% or 70,500) and 65 years and over (26% or 89,600) used public transport.

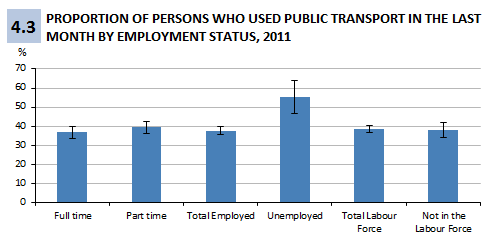
In Zones 1 and 2, 37% (544,200) of persons employed full time and 40% (221,600) of persons employed part time used public transport in the last month, significantly less than the proportion of persons who were unemployed (55% or 69,300). Of those who were not in the labour force, 38% (359,200) used public transport in the last month.

FREQUENCY OF PUBLIC TRANSPORT USE
Zone 1 patrons were more likely than Zone 2 patrons to use public transport one to two days a week (28% and 16% respectively). Zone 2 patrons (21%) were more likely to be low frequency patrons (less than once a month) than Zone 1 patrons (7%).
While a similar number of persons in Zone 1 (44% or 254,600) and Zone 2 (37% or 227,300) were high frequency patrons (three to seven days per week), nearly a third (30% or 77,700) of high frequency patrons in Zone 1 were in the highest equivalised household income quintile, compared with just over one in ten (12% or 26,600) in Zone 2.
MAIN REASON FOR USING PUBLIC TRANSPORT
Over half of public transport patrons in the total of Zones 1 and 2 (55% or 657,100) cited “More convenient than own transport/Less stress/Reduced travel time” as the main reason that public transport was used. “Cheaper than own transport" was cited by less than one in ten (9% or 111,800) public transport patrons.
Employed patrons in Zones 1 and 2 were more likely to respond that public transport was more convenient than their own transport, it was less stressful or it reduced travel time (64%) than those who responded they have no private form of transport or their own transport was unavailable (16%).
A quarter (25%) of unemployed patrons cited “More convenient than own transport/Less stress/Reduced travel time”, compared to a third (35%) who cited "Have no private form of transport/Own transport unavailable".
For patrons not in the labour force, 43% cited “More convenient than own transport/Less stress/Reduced travel time” and 31% cited "Have no private form of transport/Own transport unavailable".
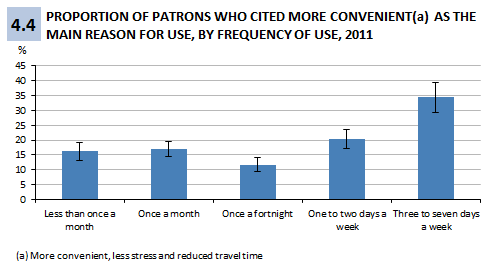
Patrons in both Zones 1 and 2 who cited “More convenient than own transport/Less stress/Reduced travel time” were more likely to be high frequency patrons (34% or 226,300) than all other frequencies of use (Figure 4.4).

Furthermore, over a quarter (26% or 82,000) of patrons in Zone 2 who cited “More convenient than own transport/Less stress/Reduced travel time” used public transport less than once a month, significantly higher than the proportion of Zone 1 patrons (7% or 24,500).
In Zone 1, 66% of patrons who cited “Cheaper than own transport” as the main reason for using public transport were high frequency users, significantly higher than the proportion of high frequency users in Zone 2 who cited the same reason (42%).
MAIN REASON FOR NOT USING PUBLIC TRANSPORT
Of the 1.9 million people in Zones 1 and 2 who did not use public transport in the last month, 75% (1.4 million) cited "Use own car for convenience/comfort/privacy" as the main reason for not using public transport, and 19% (352,600) who cited "Public transport services are inadequate, inconvenient or unavailable".
Footnotes
1. The scope of the public transport chapter includes only people aged 18 years and over usually residing in Metropolitan Public Transport Zones 1 and 2 within Melbourne MSR. Metropolitan Public Transport Zones 1 and 2 had a population of 3.1 million people aged over 18 at the time of enumeration. In the year ending 30 June 2011, the total population (all ages included) for the Melbourne MSR was 4.1 million (ABS 2012). For more information, refer to the Glossary.
|
References
ABS (Australian Bureau of Statistics) 2012,
Regional Population Growth, Australia, 2011, cat. no. 3218.0, ABS, Canberra
BITRE (Bureau of Infrastructure, Transport and Regional Economics) 2009,
Australian Strategic Transportation Agenda for Research and Technology,
Australian Transport Council
<
http://www.bitre.gov.au/collaboration/files/ASTART_FINAL_endorsed_by_ATC_6_Nov_2009.pdf> last viewed on 15 May 2012.
DoT (Department of Transport) 2012,
Victoria’s Productivity: contexts, trends, and implications for the transport portfolio, State Government of Victoria, Melbourne
DoT (Department of Transport) 2012a,
Efficiency and environmental sustainability, State Government of Victoria, Melbourne
<
http://www.transport.vic.gov.au/research/sustainability> last viewed on 15 May 2012
Dodson, J, Mees, P, Stone, J & Burke, M 2011,
The Principles of Public Transport Network Planning: A review of the emerging literature with selected examples, Urban Research Program Issues Paper 15, Griffith University, Brisbane.
IA (Infrastructure Australia) 2011,
Cities, Commonwealth of Australia, Canberra
<
http://www.infrastructureaustralia.gov.au/cities/> last viewed on 15 May 2012
TTF (Tourism and Transport Forum) 2010,
Tourism & Transport Forum Position Paper: The benefits of public transport, Sydney
<
http://www.ttf.org.au/DisplayFile.aspx?FileID=822> last viewed 5 May 2012
 Print Page
 Print All