|
|
NOTES
INTRODUCTION
The health benefits of physical activity are widely recognised. This article provides a brief overview of physical activity levels among Australians, including for key population groups. Physical inactivity is an important health risk factor and this article includes information about the demographic characteristics, health status and related risk factors of people who do little or no exercise, and describes associated mortality and health system costs. It also presents information on people who have moderate or high levels of exercise, and presents other information about physical activity such as the most popular physical activities, sports injuries, and associated costs.
DATA SOURCES
Unless otherwise stated, this article presents information reported by respondents in the 2004-05 National Health Survey (NHS). Data were collected from people aged 15 years and over living in private dwellings over a ten month period to account for the influence of seasonal factors. Those living in hospitals, nursing and convalescent homes and hospices were not in the scope of the survey.
This article also draws on data from the 2004-05 National Aboriginal and Torres Strait Islander Health Survey (NATSIHS), the 2002 Survey of Participation in Sport and Physical Activities, the April 2006 Survey of Children's Participation in Cultural and Leisure Activities and other sources.
The NHS measures current levels of physical activity by asking respondents to report on all exercise for sport, recreation or fitness undertaken in the two weeks prior to the survey interview. From the information reported about the intensity (walking, moderate or vigorous exercise), frequency and duration of recent exercise, people were classified to an exercise level of sedentary, low, moderate or high (footnote 1).
It should be noted that the NHS data relates to reported physical activity for sport, recreation or fitness only. It excludes physical activity as part of a person's occupation, and activity such as gardening or walking for transport. The data therefore are not necessarily indicative of overall physical activity levels for all persons. It should also be noted that physical activity is a difficult concept to measure in self-reported population surveys, and the quality of the data depends on respondents' willingness and ability to assess and report all physical activity (footnote 2).
INQUIRIES
For further information about these and related statistics, contact the National Information and Referral Service on 1300 135 070 or email client.services@abs.gov.au.
PHYSICAL ACTIVITY
Suitable regular daily physical activity is a major factor in preventing chronic diseases and can provide a wide range of physical, social and mental health benefits (WHO 2006a).
Physical inactivity increases all causes of mortality, doubles the risk of cardiovascular disease, Type 2 diabetes, and obesity. It also increases the risks of colon and breast cancer, high blood pressure, lipid disorders, osteoporosis, depression and anxiety (WHO 2006b). The 2003 Australian Burden of Disease Study indicates that physical inactivity was the fourth leading cause of burden of disease in Australia. It was estimated that physical inactivity was responsible for approximately 7% of the total burden of disease and injury for all Australians (6% of total for males and 7% of total for females) (Begg et. al. in press in AIHW 2006).
The National Physical Activity Guidelines for adults in Australia recommend at least 30 minutes of moderate-intensity physical activity (including brisk walking) on most days of the week, with each session lasting at least 10 minutes. This is generally interpreted as 30 minutes on at least five days of the week, a total of at least 150 minutes of moderate activity per week. The guidelines for children and adolescents recommend at least 60 minutes of moderate to vigorous physical activity every day (AIHW 2006).
Results of the NHS cannot be assessed directly in terms of these Guidelines. However, for the purposes of making broad comparisons based on whether enough exercise is undertaken to meet the activity levels recommended in the Guidelines, two groups are identified in this article:
- people aged 15 and over with a sedentary or low exercise level as defined in the NHS - in general these people fall below the activity levels recommended in the Guidelines;
- people aged 15 and over with a moderate or high exercise level as defined in the NHS - in general these people meet or exceed the recommended activity levels (footnote 3).
SEDENTARY AND LOW EXERCISE LEVELS
- In 2004-05, 70% of Australians aged 15 years and over were classified as sedentary or having low exercise levels. Of these, just under half (48%) recorded no or very little exercise in the previous two weeks (sedentary exercise level) and 52% recorded a low level of exercise.
- The proportions reporting sedentary or low exercise levels have not changed significantly over the last ten years, based on age-adjusted estimates from the last three National Health Surveys (69% in 1995, 69% in 2001, and 70% in 2004-05) (footnote 4).
Age and sex
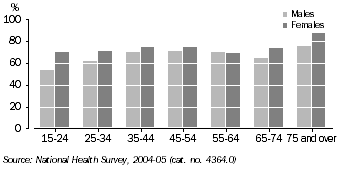
- As might be expected, sedentary or low levels of exercise were most commonly reported by those aged 75 years and over (83%) and least reported by young people aged 15-24 years (62%) (footnote 5). However, in all age groups (15 years and over) about two thirds or more had sedentary or low exercise levels.
- Women were more likely to be sedentary or have low levels of physical activity than men. Of those aged 15 years and over, 73% of females reported sedentary or low exercise levels compared with 66% of males.
Chart 1: Sedentary or low exercise levels, 2004-05
Country of birth
- In 2004-05, Australians aged 15 years and over born in Southern and Eastern Europe (79%), or Southern and Central Asia (81%), were more likely to be sedentary or have low exercise levels than those born in Australia (69%), after adjusting for age differences.
- The women born in these regions have particularly low levels of exercise - 88% of Southern and Central Asian women and 86% of Southern and Eastern Europe women were sedentary or exercised at a low level.
Health status
- While most of those who were sedentary or exercised at a low level considered they had excellent or very good health (52%), people with moderate to high exercise levels were more likely to report excellent or very good health (67%).
- Adults aged 18 years and over who were sedentary or exercised at a low level were more likely to be classified as having a high or very high level of psychological distress (footnote 6) than those who had moderate to high exercise levels (15% compared with 9%).
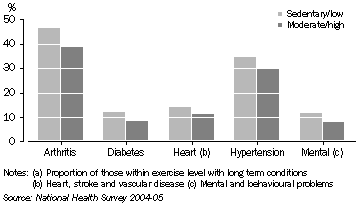
- People aged 15 years and over who were classified as having sedentary or low levels of activity were more likely to report having a long term condition than those with moderate to high exercise levels, particularly in older age groups where long term medical conditions are most common and exercise levels are lower. For example, among those aged 55 years or more, the proportion reporting arthritis was higher among people who were sedentary or exercised at low levels (46%) than people who exercised at moderate or high levels (39%). Similarly in this age group, people with sedentary or low exercise levels were more likely than people with moderate to high exercise levels to report diabetes (12% compared with 9%), heart, stroke and vascular disease (14% compared with 11%) (footnote 7), and hypertension (35% compared with 30%). This may in part reflect the impact of these diseases on respondents' lifestyle behaviours.
Chart 2: Persons aged 55 years and over with long term conditions (a), 2004-05
Risk factors
- Physical activity is an independent risk factor as well as acting to modify other risks such as hypertension, obesity, high-density lipoproteins and total cholesterol (Bauman 1991 in DoHAC & ASC 2000).
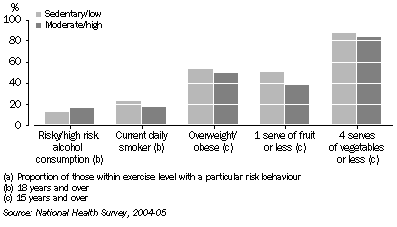
- People aged 15 years and over who were sedentary or exercised at low levels were more likely to be classified as obese (20%) than people who exercised at moderate or high levels (13%) (footnote 8).
- Fruit and vegetable consumption reported by people who were sedentary or exercised at low levels was more likely to be under the recommended levels than people who exercised at moderate or high levels. Half (50%) of those with sedentary or low exercise levels reported consuming less than two serves of fruit per day (the recommended daily intake), compared with 38% of people with moderate or high exercise levels (footnote 9). With regard to vegetable intake, the difference was less marked, with similarly high proportions (87% compared with 83%) not reporting the recommended daily intake of five serves or more.
- Adults who were sedentary or exercised at low levels were slightly less likely than adults with moderate or high exercise levels to consume alcohol at a risky or high risk level (13% compared with 16%) (footnote 10), but slightly more likely to be current daily smokers (23% compared with 17%).
Chart 3: Risk behaviour and exercise level (a), 2004-05
Mortality
- Globally, physical inactivity is estimated to cause two million deaths per year, representing an estimated 10-16% of cases each of breast cancer, colon cancers, and diabetes, and about 22% of ischaemic heart disease cases (WHO 2006a).
- In Australia, physical inactivity contributes to the risk of 6,400 deaths per annum from coronary heart disease, non-insulin dependant diabetes mellitus and colon cancer, and up to 2,200 more due to other conditions, including breast cancer and stroke (DoHAC & ASC 2000).
Health system costs
- Based on analysis of 1996 mortality and morbidity statistics, the annual direct health care costs attributable to physical inactivity was around $377 million per year (DoHAC & ASC 2000).
- For each disease, costs were estimated to be $161 million for coronary heart disease, $28 million for non-insulin dependant diabetes mellitus, $16 million for colon cancer, $101 million for stroke, $16 million for breast cancer, and up to $56 million for depressive disorders (DoHAC & ASC 2000).
MODERATE AND HIGH EXERCISE LEVELS
- In 2004-05, 30% of those aged 15 years and over reported exercising at moderate or high levels.
- Of these, 78% were classified as having a moderate exercise level, and 22% were classified as having a high exercise level, based on reported activity in the previous two weeks.
- As might be expected, people categorised as having moderate or high exercise levels were more likely to report a type of exercise they described as moderate (70%) or vigorous intensity (41%) than people with sedentary or low exercise levels (22% and 5% respectively) (footnote 1).
- Most people aged 15 years and over (71%) classified to moderate or high exercise levels reported walking for exercise. Of these, 42% reported engaging in moderate intensity exercise in addition to walking, and 25% reported walking as the only type of exercise they had done for sport, recreation or fitness in the previous 2 weeks.
- Of people aged 15 years or more classified as exercising at moderate or high levels, more males reported moderate or vigorous activity (72% and 45%) than females (68% moderate and 36% vigorous).
- The most commonly reported average duration of vigorous exercise among people exercising at moderate or high levels was 60 to 89 minutes (36%), followed by 90 minutes or more (29%) and 30-59 minutes (26%). The most commonly reported average duration of moderate exercise was 90 minutes or more (35%), followed by 60-89 minutes (33%) and 30-59 minutes (23%).
TYPES OF EXERCISE
Walking
- Walking is beneficial through improving fitness and/or greater physiological activity and energy turnover. Walking is also the most common weight-bearing activity, with indications at all ages of an increase in related bone strength (Morris JN & Hardman AE, 1997).
- In 2004-05, walking was a common form of exercise, with nearly half (49%) of those aged 15 years and over reporting walking as a form of exercise in the previous two weeks.
- Walking was the only form of exercise for 25% of those aged 15 years and over, (21% of males and 29% of females).
- Females were more likely to walk for exercise (53%) than males (44%).
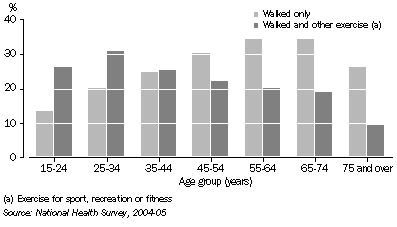
- The proportion reporting walking as the only form of exercise increases with age. At 15-24 years, only 14% reported walking as their only form of exercise, compared with 35% of those aged 65-74 years.
- The average duration of all walking sessions undertaken in the previous two weeks was most commonly a half to one hour (30-59 minutes), which was reported by 48% of those who walked for exercise.
- The 2004-05 NHS also collected data on walking undertaken for at least ten minutes in the previous day for purposes other than sport, recreation or fitness (for example, to travel somewhere). Of Australians aged 15 years and over, 42% reported doing such walking.
Chart 4: Walking for exercise, 2004-05
SPORTS AND RECREATIONAL ACTIVITIES
Type of activity
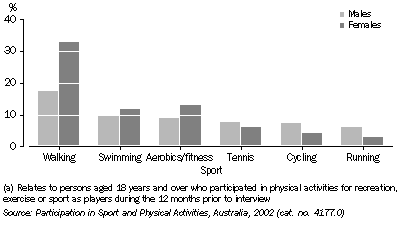
- The 2002 Survey of Participation in Sport and Physical Activities collected information on whether adults aged 18 years and over participated in a range of physical activities in the previous 12 months. Aerobics/fitness, swimming, cycling, tennis and running were among the top ten physical activities reported as being undertaken in the previous 12 months (ABS 2003).
- The three most popular activities for males were walking for exercise (18%), golf (12%) and swimming (10%), while the three most popular activities for females were walking for exercise (33%), aerobics/fitness (13%) and swimming (12%) (ABS 2003).
Chart 5: Adult participation in sports and physical recreation activities (a), 2002
Sports injuries
- In 2004-05, 16% of persons aged 15 years and over with a long term condition reported that one or more condition had been caused by an injury. One quarter (25%) of these were reported as injuries occurring during exercise or sport.
- Of people reporting a long term condition arising from an injury during exercise or sport, almost three-quarters (71%) reported a musculoskeletal condition. Back pain/disc problems were the most commonly reported musculoskeletal condition (39% of people reporting conditions due to exercise and sport injuries).
- In 2004-05, 18% of all persons reported an injury in the previous four weeks. Of these, 13% reported that their most recent injury occurred during sport, and 27% reported being injured during leisure activities (footnote 11).
- More than half (57%) of recent injuries that occurred when undertaking sport or leisure activities occurred to the legs or feet.
- Open wounds (38%) and bruising (33%) were the most common types of recent injury reported from undertaking sports or leisure activities in the last four weeks. Dislocations, sprains, strains and torn muscles or ligaments were reported by 20% of those with a recent injury due to sport or leisure activities.
Hospitalisations and health system costs
- Of those who reported having a recent sports or leisure injury, 7% reported attending hospital as a result of the injury. The majority of these (88%) attended casualty/emergency only.
- Sports and recreation related hospitalisations in the 2002-2003 financial year (45,452) were 0.7% of total hospitalisations (Flood L & Harrison JE 2006).
- Although there were a greater number of females aged 15 years and over participating in sports and recreation, 74% of hospitalisations relating to sports and recreation occurred in males (Flood L & Harrison JE 2006).
- For those aged 15 years and over, wheeled motor sports had the highest rate of hospitalisations per 100,000 participants (942.7), followed by roller sports (e.g. rollerbladers, skaters, skateboarders) (738.6), Australian rules football (734.3) and equestrian pursuits (692.7) (Flood L & Harrison JE 2006).
- Sports injuries cost Australia $1.83 billion in 2003 (Medibank 2004).
INDIGENOUS AUSTRALIANS
- The 2004–05 National Aboriginal and Torres Strait Islander Survey (NATSIHS) collected information about the frequency, intensity and duration of exercise undertaken by Indigenous Australians aged 15 years and over in non-remote areas. Among those surveyed, around three-quarters (75%) were categorised as either sedentary or engaged in low levels of exercise, 18% reported moderate exercise levels and 7% reported high exercise levels (ABS 2006b).
- Indigenous people who engaged in moderate or high levels of exercise were more likely to report excellent or very good self-assessed health than those with sedentary or low levels of exercise (57% compared with 40%) (ABS 2006b).
- The overall prevalence of arthritis, diabetes mellitus, heart, stroke and vascular diseases was significantly higher among Indigenous people reporting sedentary/low levels of exercise (18%, 8% and 5% respectively) than among those who exercised at moderate/high levels (13%, 5% and 2% respectively) (ABS 2006b).
- Indigenous people in the sedentary/low exercise category were more likely to be daily smokers than those who reported a moderate or high level of exercise (46% compared with 32%). The difference was most marked among Indigenous people aged 18-24 years (51% compared with 35%) (ABS 2006b).
CHILDREN
- Regular practice of physical activity helps children and young people to build and maintain healthy bones, muscles and joints, helps control body weight, helps reduce fat and develop efficient function of the heart and lungs (WHO 2006c).
- In the 12 months to April 2006, 64% of children aged 5-14 years participated in sport, outside of school hours, which had been organised by a school, club or association. This was an increase of two percentage points in the rate of participation from 2003 (ABS 2006c).
- Children who were involved in organised sport spent an average of six hours on sport per school fortnight (ABS 2006c).
- The most popular sport participated in by children was swimming, with a participation rate of 17%, followed by outdoor soccer (13%) (ABS 2006c).
- Children spent an average of 20 hours over a school fortnight in the 12 months to April 2006 watching television, videos or DVDs and also spent an average of eight hours playing electronic or computer games (ABS 2006c). The Australian Physical Activity Guidelines for Children and Youth recommend that children and youth should not spend more than two hours a day using electronic media for entertainment (DoHA 2005).
FOOTNOTES
1. Exercise level in the NHS is based on frequency, intensity (i.e. walking, moderate exercise and vigorous exercise) and duration of exercise (for recreation, sport or fitness) in the two weeks prior to the interview. From these components, an exercise score was derived using factors to represent the level of the exercise. Scores were grouped into the following four categories:
EXERCISE LEVEL SCORE
|
| Sedentary | Less than 100 (includes no exercise) |
| Low | 100 to less than 1600 |
| Moderate | 1600-3200, or more than 3200 but less than 2 hours of vigorous exercise |
| High | More than 3200 and 2 hours or more of vigorous exercise |
|
Back
2. Respondents were asked about walking for sport, recreation or fitness, moderate exercise (causing a moderate increase in heart rate or breathing) and vigorous exercise (causing a large increase in heart rate or breathing) they had done in the previous two weeks. The application of these definitions reflects the respondent's perception of the level and purpose of particular physical activities. Responses may have varied according to the type of activity performed, the intensity with which it was performed, the level of fitness of the participant, and their general health and other characteristics (e.g. age). Back
3. Exercise at the minimum level recommended in the National Physical Activity Guidelines for Australians (moderate exercise for 30 minutes or more on five days or more each week) would result in an exercise level score (as used in the NHS) of 1500. Although this score lies just within the low exercise level category, for the purposes of this article, persons categorised to the moderate or high exercise levels generally can be regarded as exercising at or above the recommended levels. Back
4. Since many health characteristics are age-related, the age profile of the populations being compared needs to be considered when interpreting the data. To account for the differences in age structure, for example, where data are presented in this publication for comparison over time, they are stated as age standardised percentages. For further detail, see the Explanatory Notes of the National Health Survey: Summary of Results, 2004-05 (cat. no. 4364.0). Back
5. In the 2004-05 NHS, data about children aged 15-17 years was self-reported in 33% of cases, and was provided by a proxy (i.e. an adult, usually a parent) in the remaining 67% of cases. However, there is no evidence of major quality issues associated with the data provided by proxies for physical activity. For further information see National Health Survey: Users' Guide, 2004-05 (cat. no. 4363.0.55.001). Back
6. The Kessler Psychological Distress Scale-10 (K10) is used as a measure of non-specific psychological distress. A very high level of psychological distress, as shown by the K10, may indicate a need for professional help. In the 2004-05 NHS, the K10 questions were asked of adults aged 18 years and over. For more information on the K10, see Australian Bureau of Statistics, Information paper - Use of Kessler Psychological Distress Scale in ABS Health Surveys, 2003 cat. no. 4817.0.55.001. Back
7. Heart, stroke and vascular conditions comprise the following:
- Angina and other ischaemic disease
- Cerebrovascular disease
- Oedema and heart failure
- Diseases of arteries, arterioles and capillaries Back
8. Body Mass Index (BMI) is calculated from reported height and weight information, using the formula weight (kg) divided by the square of height (m). To produce a measure of the prevalence of overweight or obesity in adults, BMI values are grouped according to the table below which allows categories to be reported against both the World Health Organization and National Health and Medical Research Council guidelines. In this article, only persons who reported both height and weight were included in the calculation of percentages. This classification may not be suitable for all ethnic groups, who may have equivalent levels of risk at lower BMI (for example Asians) or higher BMI (for example Polynesians) compared with the standard (AIHW 2006). Back
BODY MASS INDEX GROUP
|
| Underweight | Less than 18.5 |
| Normal range | 18.5 to less than 25.0 |
| Overweight | 25.0 to less than 30.0 |
| Obese | 30.0 and greater |
|
The fact that some people classified to moderate and high exercise levels are obese may reflect the way in which exercise is reported (self-assessed intensity levels and episodes from the last two weeks), or issues around the assessment of Body Mass Index (based on self-reported height and weight) and the efficacy and appropriateness of the measure itself.
9. Questions in the 2004-05 NHS relating to fruit and vegetable consumption are complex as respondents needed to understand and apply the inclusions/exclusions, understand the concept of a serve and assess their consumption levels accordingly, and think about their total consumption in what would constitute an average day. For further information see National Health Survey: Users' Guide, 2004-05 (cat. no. 4363.0.55.001). Back
10. Alcohol risk levels were derived from the average daily consumption of alcohol in the seven days prior to interview and are grouped into relative risk levels as defined by the National Health and Medical Research Council (NHMRC) as follows:
ALCOHOL RISK LEVEL(a), CONSUMPTION PER DAY
Risk level
| Males | Females |
| Low risk | 50 mLs or less | 25 mLs or less |
| Risky | More than 50 mLs, up to 75 mLs | More than 25 mLs, up to 50 mLs |
| High risk | More than 75 mLs | More than 50 mLs |
(a) One standard drink contains 12.5 mLs of alcohol. Back
11. Only injuries which required medical treatment or some other form of action are included. Back
LIST OF REFERENCES
Australian Bureau of Statistics (ABS) 2006, National Health Survey: Summary of Results, Australia, 2004-05, cat. no. 4364.0, ABS, Canberra.
Australian Bureau of Statistics 2006a, National Health Survey, Australia, 2004-05, unpublished data.
Australian Bureau of Statistics 2006b, National Aboriginal and Torres Strait Islander Health Survey, 2004-05, unpublished data.
Australian Bureau of Statistics 2006c, Children's Participation in Cultural and Leisure Activities, Australia, April 2006, cat. no. 4901.0. ABS, Canberra.
Australian Bureau of Statistics 2006d, Sport and Recreation: A Statistical Overview, Australia, 2006 Edition 1, cat. no. 4156.0, ABS, Canberra.
Australian Bureau of Statistics 2003, Participation in Sport and Physical Activities, Australia, 2002, cat. no. 4177.0, ABS, Canberra.
Australian Government Department of Health and Ageing (DoHA) 2005, Australia's Physical Activity Recommendations for Children and Young People, Australian Government, Canberra.
Australian Institute of Health and Welfare (AIHW) 2006, Australia's Health 2006, AIHW cat. no. AUS 73. AIHW, Canberra.
Commonwealth Department of Health and Aged Care and Australian Sports Commission (DoHAC & ASC) 2000, The Costs of Illness attributable to Physical Inactivity in Australia: A preliminary Study, John Stephenson, Adrian Bauman, Tim Armstrong, Ben Smith and Bill Bellow. Commonwealth of Australia, Canberra.
Finch C, Valuri G and Ozanne-Smith J 1998, Sport and active recreation injuries in Australia: evidence from emergency department presentations, British Journal of Sports Medicine, January 1998.
Flood L and Harrison JE 2006 Hospitalised sports injury, Australia 2002-03, Injury Research and Statistics Series Number 27. (AIHW cat. no. INJCAT 79) AIHW, Adelaide.
Medibank Private Sports Injuries Report (Medibank), June 2004, viewed 8 December, 2006,
Morris JN & Hardman AE (1997), Walking to health, Sports Medicine, May; 23(5):306-32.
World Health Organisation (WHO) 2006a, Chronic Disease Information Sheets: Physical Activity, viewed 18 September, 2006.
World Health Organisation (WHO) 2006b, Move for Health: Sedentary lifestyle: a global public health problem, viewed 18 September, 2006.
World Health Organisation (WHO) 2006c, Physical activity and youth, viewed 18 September, 2006.
|
|
 Print Page
 Print All