|
|
NOTES
INTRODUCTION
This article provides a brief overview of the prevalence, comorbidity and mortality, risk factors, actions taken and health costs of diabetes mellitus. This paper focuses on diabetes reported by respondents as a current and long term condition.
DATA SOURCES
The article draws on data from the National Health Survey (NHS) 2004-05, previous National Health Surveys, the National Aboriginal and Torres Strait Islander Health Survey, the ABS Causes of Death Collection and the Australian Institute of Health and Welfare National Diabetes Register (footnote 1).
The estimates for diabetes and high sugar levels in the NHS 2004-05 may understate the true prevalence of these conditions in the community as they exclude those cases which have remained undetected (ABS 2006b). Based on studies comparing self-reported diabetes with medical testing for diabetes, there is evidence that for every known case of diabetes, there is one undiagnosed case (International Diabetes Institute (IDI) 2001, King & Rewers 1993).
INQUIRIES
For further information about these and related statistics, contact the National Information and Referral Service on 1300 135 070 or email client.services@abs.gov.au.
DIABETES
Diabetes is a chronic condition in which blood glucose levels become too high due to the body producing little or no insulin, or not using insulin properly. Insulin is a hormone produced by the pancreas to assist the body to use glucose (AIHW 2002). Diabetes can result in many long term health conditions, including heart disease, stroke, kidney failure, blindness and lower limb amputation (AIHW 2002). Chronic diseases such as diabetes represent a major part of the burden of disease in Australia, and may be prevented or delayed by lifestyle interventions.
TYPES OF DIABETES
There are three types of diabetes mellitus:
- Type 1: Characterised by little or no insulin production and likely to develop before 18 years of age. Treatment generally involves insulin injections and careful dietary control. It is also known as insulin-dependent diabetes.
- Type 2: Characterised by resistance in the body's ability to use insulin and likely to develop after 40 years of age. Lifestyle factors such as diet, obesity and exercise are strongly associated with Type 2 diabetes. It is also known as non-insulin dependent diabetes mellitus.
- Gestational Diabetes Mellitus: Occurs during pregnancy in about 3-8% of females not previously diagnosed with diabetes. This form of diabetes usually resolves after pregnancy. This paper does not discuss gestational diabetes further as it is not defined by the NHS as a long-term condition.
PREVALENCE
- In 2004-05, 3.6% of the Australian population, approximately 700,000 persons, reported that they had diabetes.
- In 2004-05, 13% of people with long-term diabetes reported having Type 1, 83% reported having Type 2 and 4% reported diabetes, but did not know which type.
- The number of adults with diabetes has more than doubled since 1981 (International Diabetes Institute 2006). Type 2 diabetes is more common among those aged 45 years and over. However, it is increasingly developing at younger ages, and in recent years cases have been seen in children and young people (AIHW 2006a).
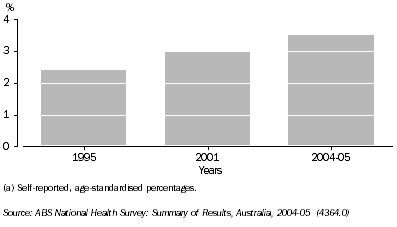
- The prevalence of diabetes reported in the NHS rose from 2.4% in 1995, to 3.0% in 2001, and 3.5% in 2004-05, after adjusting for age differences (footnote 2).
- Type 2 diabetes is the main contributor to diabetes incidence (or the number of new cases of diabetes over time). However, type 1 diabetes incidence is also increasing according to recent state-based studies (Haynes et.al. 2004; Taplin et. al. 2005).
- In 2004, the age-standardised annual incidence rate for Type 1 diabetes was 24.6 new cases per 100,000 population for 0-14 year olds and 12.3 per 100,000 population for 15-39 year olds (footnote 3) (AIHW 2006b).
Diabetes prevalence (a), 1995, 2001 and 2004-05
AGE AND SEX
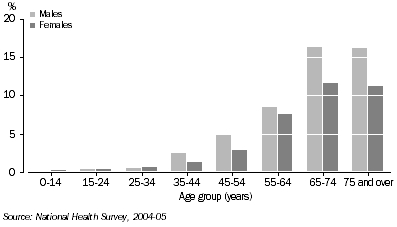
- 4.0% of males and 3.2% of females reported having diabetes mellitus in 2004-05.
- In all age groups over 35 years, males had higher rates of reported diabetes than females in 2004-05, with the peak for both sexes occurring in the 65-74 years age group.
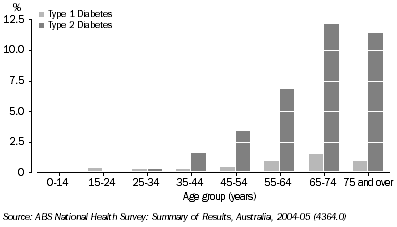
- For both types of diabetes, the prevalence rate increased with age. The proportion of Type 2 diabetes was much higher in the older age groups than the corresponding proportion for Type 1.
Diabetes prevalence by age and sex, 2004-05
Type of diabetes by age, 2004-05
INDIGENOUS AUSTRALIANS
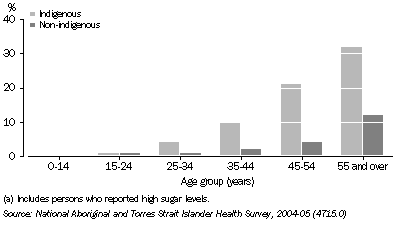
- In 2004-05, diabetes (including high sugar levels) was reported by 6% of Indigenous Australians.
- After adjusting for age differences between the two populations, Indigenous Australians were more than three times as likely as Non-Indigenous Australians to report some form of diabetes.
- Indigenous Australians living in remote rather than non-remote areas were more likely to have diabetes (9% in remote areas, 5% in non-remote areas).
Prevalence of diabetes (a) by Indigenous status and age group, 2004-05
COUNTRY OF BIRTH
- The prevalence of diabetes has previously been reported as being higher among people born overseas compared with people born in Australia (AIHW 2003).
- In 2004-05, among persons born overseas, rates of diabetes were highest for persons born in Southern and Central Asia (8.7%), North Africa and the Middle East (6.6%), South East Asia (5.7%) and Southern and Eastern Europe (4.9%) (after adjusting for age differences). By comparison, the rate of diabetes for persons born in Australia was 3.3% (footnote 4).
SOCIOECONOMIC STATUS
- In 2004-05, 29% of diabetics lived in the most disadvantaged areas, compared to 14% in the most advantaged areas, as measured as being in the first or fifth quintiles of the Index of Disadvantage (SEIFA) respectively (footnote 5).
HEALTH STATUS
- Diabetes can contribute to illness, disability, poor quality of life and premature death, especially if it is undetected or poorly controlled (AIHW 2006a).
- People who reported having diabetes tended to rate their overall health lower than those without diabetes. Of diabetics, 39% assessed their own health as fair/poor, 34% as good and 27% as very good/excellent; of those without diabetes, 15% assessed their own health as fair/poor, 28% as good and 58% as very good/excellent (after adjusting for age differences).
- From the ABS 2003 Survey of Disability, Ageing and Carers, it was estimated that about 357,000 persons with a disability had diabetes (approximately 9% of all persons who reported a disability). Of these, about 86,000 reported diabetes as their main disabling condition (ABS 2004).
- 7.6% of adults who reported having diabetes reported very high levels of psychological distress, compared to 3.7% of adults who did not report having diabetes (after adjusting for age differences).
- Diabetes is associated with long-term conditions such as diseases of the circulatory system and eyes. In particular, people with diabetes are at an increased risk of developing coronary heart disease, stroke and peripheral vascular disease (AIHW 2004).
- 20% of persons reporting diabetes also reported heart, stroke or vascular disease; 18% of those aged 45-64 years, and 27% of those aged over 65 years, had one or more of these circulatory conditions (footnote 6)
- 14% of people who reported diabetes had an eye condition due to diabetes (footnote 7).
MORTALITY
- In 2004, diabetes was a major cause of death in Australia (AIHW 2006a).
- The death rate for diabetes in 2004 was higher for males (21.0 per 100,000) than for females (13.8 per 100,000), after adjusting for age differences (ABS 2006a).
- The death rate for Type 1 diabetes was 1.7 per 100,000 compared to 4.3 per 100,000 for Type 2 diabetes, after adjusting for age differences (ABS 2006a).
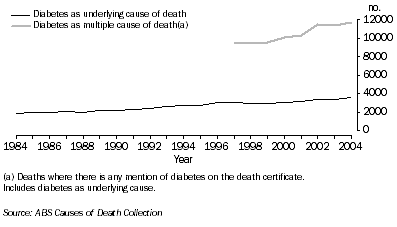
- Diabetes was the underlying cause of 2.7% of all deaths (approximately 3,600 deaths) in 2004.
- The number of deaths from diabetes as an underlying cause has been steadily increasing over the last twenty years, from approximately 1,800 deaths in 1984 to approximately 3,600 deaths in 2004. This corresponds to a rate of 15.8 per 100,000 in 1984 and 17.0 per 100,000 in 2004 (after adjusting for age differences).
- A further 6% of deaths (approximately 8,000 deaths) had diabetes as an associated cause in 2004, making a total of 8.9% of deaths (approximately 11,700 deaths) which were related to diabetes (footnote 8).
- The total number of deaths to which diabetes has contributed has increased since 1997, when the information on multiple causes of death first became available. In 1997 there were around 9,500 deaths related to diabetes. However, the rate of deaths related to diabetes has shown little change since 1997. In 1997 the rate of diabetes as multiple cause of death was 56 per 100,000; while in 2004, the rate was 55 per 100,000 (after adjusting for age differences).
Diabetes, deaths, 1984 - 2004
RISK FACTORS
- Risk factors are characteristics, conditions or behaviours that increase the possibility of disease or injury. The risk factors for diabetes can be separated into two types, modifiable (also referred to as lifestyle factors) and non-modifiable.
- Type 1 diabetes risk factors consist only of non-modifiable factors such as genetics and exposure to environmental factors (AIHW 2002).
- Although risk factors for Type 2 diabetes do include non-modifiable factors such as age, ethnicity and family history, they also include modifiable behavioural factors. These modifiable factors include excess weight, impaired glucose tolerance, physical inactivity, poor diet and nutrition and low birth weight (AIHW 2004).
Overweight and Obesity
- Overweight adults are three times more likely, and obese adults possibly ten times more likely, to develop Type 2 diabetes (AIHW 2002).
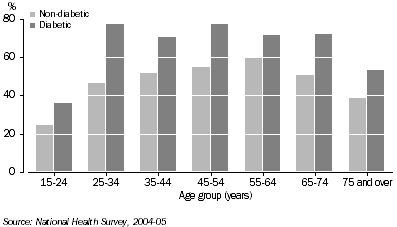
- In 2004-05, adults reporting diabetes were more likely to be classified as overweight/obese.
- 69% of those aged 15 and over who reported diabetes (and their height and weight) were classified as either overweight or obese, compared to 51% of those who did not report having diabetes (after adjusting for age differences).
- Amongst those who reported taking action for diabetes, 84% followed a changed eating pattern or diet in response to their diagnosis of diabetes.
- Amongst those who reported taking action for diabetes, 18% of persons lost weight in response to their diagnosis of diabetes.
Overweight/obesity, by age group, 2004-05
Physical Activity
- In 2004-05, 74% of those with diabetes aged 15 and over had no, or low levels of exercise, compared to 69% of those without diabetes (after adjusting for age differences) (footnote 9).
- Persons with diabetes and reporting no, or a low level of exercise, were also more likely to be living in the most disadvantaged areas (in the first or second quintiles of the Index of Disadvantage).
- Amongst those who reported taking action for diabetes, 30% reported exercising most days.
Smoking
- After adjusting for age differences, diabetics were less likely to be a current smoker (21%) than non-diabetics (23%), but more likely to be an ex-smoker (33% compared with 30%).
ACTIONS TAKEN
- 21% of persons reporting diabetes had daily insulin injections.
- Of persons with Type 1 diabetes, 93% reported having daily insulin injections compared to 10% with Type 2 diabetes (footnote 10).
- Of persons reporting diabetes, 68% used pharmaceutical medications for that condition in the two weeks prior to the survey, and 4% used vitamin or mineral supplements or herbal or natural medicines.
- After adjusting for age differences, persons with diabetes reported higher levels of recent visits to general practitioners (31% compared to 19% for non-diabetics). Also, 8.5% of diabetics had recently visited outpatient clinics, compared to 1.7% of non-diabetics.
HEALTH SYSTEM COSTS
- In 2000-01 in Australia, health system costs due to diabetes were estimated at $0.8 billion. This figure represents 1.7% of the total national expenditure on diseases (AIHW 2004).
- However, diabetes is also related to diseases such as cardiovascular and renal diseases, (IDI 2006) thus total health expenditure attributable to diabetes is actually greater than $0.8 billion.
- In 2003-04, 0.9% of hospital separations were due to Type 1 and Type 2 and other specified and unspecified diabetes mellitus. Of these, 73% were due to Type 2 diabetes (AIHW 2005b).
DIABETICS AGED 45 AND OVER
- Susceptibility to Type 2 diabetes, the most common type of diabetes in the Australian population, is enhanced with increasing age (AIHW 2002).
- For diabetics over the age of 45, the rate of reporting of fluid problems/fluid retention, high cholesterol and angina was more than twice that of non-diabetics. High blood pressure, angina and stroke were also reported at higher rates in diabetics than non-diabetics (rate ratio of 1.9, 2.6 and 1.6 respectively).
- For diabetics over the age of 45, the rate of reporting of overweight or obesity is 1.3 times higher than for non-diabetics.
- Diabetics over the age of 45 were also less likely to be employed than non-diabetics (rate ratio 0.9).
- Diabetics in this age group are more likely to be living in areas of greater disadvantage, as measured by the Index of disadvantage (1st and 2nd quintiles, rate ratio of 1.4).
Diabetic and non-diabetic persons, 45 years and over
 | Diabetics | Non-diabetics | Rate ratio (b) |
 | %(a) | %(a) |  |
| Type of heart or circulatory condition (c) |  |  |  |
| High blood pressure | 47.3 | 24.4 | 1.9 |
| Fluid problems/fluid retention | 7.6 | 2.8 | 2.7 |
| High cholesterol | 33.4 | 14.9 | 2.2 |
| Angina | 6.5 | 2.5 | 2.6 |
| Heart attack | *1.8 | 1.0 | *1.7 |
| Stroke | *1.6 | 1.0 | *1.6 |
| No heart or circulatory condition | 31.2 | 58.7 | 0.5 |
| Body Mass Index |  |  |  |
| Obese/overweight | 75.7 | 57.6 | 1.3 |
| Physical activity |  |  |  |
| Low/none | 78.0 | 72.4 | 1.1 |
| Labour force status |  |  |  |
| Employed | 42.4 | 48.6 | 0.9 |
| Not in the labour force | 56.5 | 50.1 | 1.1 |
| Main source of personal income |  |  |  |
| Wage or salary | 27.3 | 31.4 | 0.9 |
| Government pension and allowances | 47.8 | 37.3 | 1.3 |
| Total weekly personal income |  |  |  |
| Less than 300 | 46.9 | 36 | 1.3 |
| 700 and over | 24.9 | 26.2 | 1.0 |
| Index of disadvantage |  |  |  |
| 1st and 2nd quintiles | 52.2 | 37.1 | 1.4 |
| 3rd quintile | 16.0 | 19.9 | 0.8 |
| 4th and 5th quintiles | 31.9 | 43.0 | 0.7 |
 |
| (a) Age standardised rate. |
| (b) Rate ratio is calculated by dividing the proportion of diabetics by the proportion of non-diabetics. |
| (c) Persons may have more than one condition specified. |
| (d) Rates do not include persons for whom the characteristic was unknown or not stated. |
| * Estimate has a relative standard error of 25% to 50% and should be used with caution. |
 |
| Source: National Health Survey, 2004-05 |
FOOTNOTES
1. The AIHW National Diabetes Register (NDR) is a database that collects information about people who use insulin as part of their treatment for diabetes. It includes persons who began using insulin for management of diabetes on and since 1 January 1999, and who have consented to be included in the NDR. These include persons using insulin to manage Type 1, gestational and Type 2 diabetes. Back
2. Since many health characteristics are age-related, the age profile of the populations being compared needs to be considered when interpreting the data. To account for the differences in age structure, where noted, some estimates within this publication are shown as age standardised percentages, using the Australian estimated resident population at June 30 2001 as the standard population. For further detail, see the Explanatory Notes of the National Health Survey: Summary of Results, 2004–05 (cat. no. 4364.0). Back
3. Data from the National Diabetes Register (NDR) held at AIHW, published in: Australian Institute of Health and Welfare (AIHW) 2006, Incidence of Type 1 diabetes in Australians under 40 years: A snapshot of National Diabetes Register data for 2004. Back
4. Estimates for Southern and Central Asia, North Africa and the Middle East, and South East Asia have a relative standard error between 25% and 50% and should be used with caution. Back
5. This is one of four Socio Economic Indexes for Areas (SEIFAs) compiled by ABS following each Census of Population and Housing. The indexes are compiled from various characteristics of persons resident in particular areas; the index of disadvantage summarises attributes such as low income, low educational attainment, high unemployment and jobs in relatively unskilled occupations. As shown in this publication 1st quintile refers to the most disadvantaged group, while 5th quintile refers to the least disadvantaged group. For further information about SEIFAs see Chapter 6 of the 2004-05 National Health Survey: Users' Guide. Back
6. Includes ischaemic heart disease, cerebrovascular disease, oedema and heart failure, and diseases of the arteries, arterioles and capillaries. Back
7. Excludes persons with diabetes who did not state whether their eye condition was due to diabetes or who did not know whether their eye condition was due to diabetes. Back
8. Multiple causes of death include all causes and conditions reported on the death certificate (i.e. both underlying and associated causes). Back
9. Excludes respondents for whom level of physical activity was not stated. Back
10. Excludes persons for whom it was unknown if they were having insulin injections. Back
LIST OF REFERENCES
Australian Bureau of Statistics 2006a, Causes of Death, Australia, 2004, cat. no. 3303.0, ABS, Canberra.
Australian Bureau of Statistics 2006b, National Health Survey: Summary of Results, Australia 2004-05, cat. no. 4364.0, ABS, Canberra.
Australian Bureau of Statistics 2006c, National Health Survey, Australia 2004-05, unpublished data.
Australian Bureau of Statistics 2006d, National Aboriginal and Torres Strait Islander Health Survey, Australia 2004-05, cat. no. 4715.0, ABS, Canberra.
Australian Bureau of Statistics 2004, Disability, Ageing and Carers, Australia: Summary of Findings 2003, cat. no. 4430.0, ABS, Canberra
Australian Institute of Health and Welfare 2006a, Australia's Health 2006, AIHW cat No. AUS 73, AIHW, Canberra.
Australian Institute of Health and Welfare 2006b, Incidence of Type 1 diabetes in Australians under 40 years: A snapshot of National Diabetes Register data for 2004, AIHW Cat. no. AUS 76, AIHW, Canberra.
Australian Institute of Health and Welfare 2005a, GRIM (General Record of Incidence of Mortality) Books, AIHW, Canberra.
Australian Institute of Health and Welfare 2005b, National Hospital Morbidity Database, Separation, patient day and average length of stay statistics by principal diagnosis ICD-10-AM, Australia, 1998-99 to 2003-04, viewed 21 July, www.aihw.gov.au/cognos/cgi-bin/ppdscgi.exe?DC=Q&E=/AHS/principaldiagnosis0304
Australian Institute of Health and Welfare 2004, Australia's Health 2004, AIHW Cat. No. AUS 44, AIHW, Canberra.
Australian Institute of Health and Welfare 2003, National diabetes register statistical profile December 2001, Diabetes Series No. 4., AIHW Cat. No. CVD 24, AIHW, Canberra.
Australian Institute of Health and Welfare 2002, Diabetes: Australian Facts 2002, Diabetes Series No. 3 AIHW Cat. No. CVD 20, Canberra.
Haynes, A, Bower, C, Bulsara, MK, Jones, TW, & Davis, EA 2004, 'Continued increase in the incidence of childhood Type 1 diabetes in a population-based Australian sample (1985-2002)', Diabetologia, vol. 47, no. 5, pp. 866-870.
International Diabetes Institute 2006, 'Tracking the Accelerating Epidemic: Its Causes and Outcomes', The Australian Diabetes, Obesity and Lifestyle Study (AusDiab) 2006, Melbourne.
International Diabetes Institute 2000, 'Diabesity & Associated Disorders in Australia 2000', The Australian Diabetes, Obesity and Lifestyle Study (AusDiab) 2001, Melbourne.
King, H, & Rewers, M 1993, 'Global estimates for prevalence of diabetes mellitus and impaired glucose tolerance in adults', Diabetes Core, vol. 6, no. 1, pp. 157-77.
Taplin, CE, Craig, M, Lloyd, M et.al. 2005, 'The rising incidence of childhood Type 1 diabetes in New South Wales, 1990-2002', Medical Journal of Australia, vol. 183, no. 5, pp. 243-6.
Tuomilehto, J, Lindstrom, J, Eriksson, J, et al. 2001, 'Prevention of Type 2 diabetes mellitus by changes in lifestyle among subjects with impaired glucose tolerance', New England Journal of Medicine, vol. 344, no. 18, pp. 1343-50.
|
|
 Print Page
 Print All