TELEVISIONS
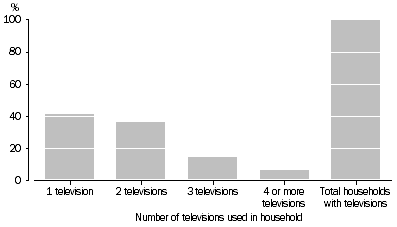
In October 2009, almost all households in Queensland used at least one television (99.3% or 1,642,200). There were 687,300 (42% of total households) that used one television only, 604,200 (37%) that used two televisions, 15% (243,200) that used three televisions and a further 7% (107,500) that used four or more (table 3.12).
Proportion of households, Number of televisions used
: Qld
- Oct. 2009

Types of televisions
In Queensland in October 2009, of the 1,642,200 households that used televisions, 1,170,000 (71%) used at least one cathode ray tube (CRT) television, while 901,800 (55%) used at least one flat screen television, for example plasma or liquid crystal display (LCD). Households could have more than one of each type of television.
Televisions by selected household characteristics
Annual household income
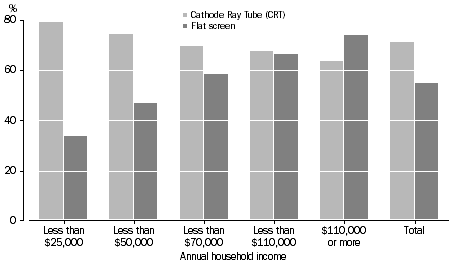
In October 2009, the proportion of Queensland households having the older style CRT television decreased as household income increased. About eight out of ten households (79% or 256,500) with an annual income of less than $25,000 had a CRT television compared with 64% (or 172,400) of households with an annual income of $110,000 or more.
The proportion of Queensland households with a flat screen television increased as household income increased. Of the households with an annual income of less than $25,000, 34% (109,500) had a flat screen television compared with 74% (or 200,200) of households with an annual income of $110,000 or more (table 3.13).
Proportion of Households, Selected television type
- Annual household income
: Qld
- Oct. 2009

Family composition
Looking at types of family composition, of the 101,000 lone parent families with dependent children using at least one television, 81% (82,100) used a CRT television and 45% (45,400) used a flat screen television. In comparison, of the 439,400 couple families with dependent children using at least one television, 74% (325,500) used a CRT television and 67% (295,600) used a flat screen television. There were 455,900 couple only families using at least one television, of which 65% (294,500) used a CRT television and 59% (268,800) used a flat screen television (table 3.14).
3.12 HOUSEHOLDS, Televisions used: Qld - Oct. 2009 |
|
 | One television | Two
televisions | Three
televisions | Four or more televisions | Total households
with television | No televisions
used | Total |
|
| Number ('000) | 687.3 | 604.2 | 243.2 | 107.5 | 1 642.2 | 11.8 | 1 654.0 |
| Proportion (%) | 41.6 | 36.5 | 14.7 | 6.5 | 99.3 | 0.7 | 100.0 |
|
3.13 HOUSEHOLDS WITH TELEVISIONS, Type of television - Household income: Qld - Oct. 2009 |
|
 |  | Cathode Ray
Tube (CRT) | Flat screen | Total households(a)(b) |
|
| Number ('000) |  |  |  |
 | Less than $25,000 | 256.5 | 109.5 | 324.4 |
 | $25,000 to less than $50,000 | 276.6 | 174.5 | 371.9 |
 | $50,000 to less than $70,000 | 180.3 | 150.9 | 258.3 |
 | $70,000 to less than $110,000 | 238.0 | 233.2 | 350.6 |
 | $110,000 or more | 172.4 | 200.2 | 270.2 |
 | Total(c) | 1 170.0 | 901.8 | 1 642.2 |
| Proportion (%) |  |  |  |
 | Less than $25,000 | 79.1 | 33.8 | 100.0 |
 | $25,000 to less than $50,000 | 74.4 | 46.9 | 100.0 |
 | $50,000 to less than $70,000 | 69.8 | 58.4 | 100.0 |
 | $70,000 to less than $110,000 | 67.9 | 66.5 | 100.0 |
 | $110,000 or more | 63.8 | 74.1 | 100.0 |
 | Total(c) | 71.2 | 54.9 | 100.0 |
|
| (a) Includes households with projectors, other television types and television type not known. |
| (b) May not add to sum of components as households may have more than one type of television. |
| (c) Includes households with no income, amount of regular income not known and refusals. |
 |
3.14 HOUSEHOLDS WITH TELEVISIONS, Type of television - Family composition: Qld - Oct. 2009 |
|
 |  | Cathode Ray
Tube (CRT) | Flat screen | Total households(a)(b) |
|
| Number ('000) |  |  |  |
 | Person living alone | 245.2 | 120.5 | 343.9 |
 | Couple only | 294.5 | 268.0 | 455.9 |
 | Couple family with dependent children(c) | 325.5 | 295.6 | 439.4 |
 | Lone parent family with dependent children(c) | 82.1 | 45.4 | 101.0 |
 | All other households(d) | 222.7 | 172.3 | 302.0 |
 | Total | 1 170.0 | 901.8 | 1 642.2 |
| Proportion (%) |  |  |  |
 | Person living alone | 71.3 | 35.0 | 100.0 |
 | Couple only | 64.6 | 58.8 | 100.0 |
 | Couple family with dependent children(c) | 74.1 | 67.3 | 100.0 |
 | Lone parent family with dependent children(c) | 81.3 | 45.0 | 100.0 |
 | All other households(d) | 73.7 | 57.0 | 100.0 |
 | Total | 71.2 | 54.9 | 100.0 |
|
| (a) Includes households with projectors, other television types and television type not known. |
| (b) May not add to sum of components as households may have more than one type of television. |
| (c) Includes households with additional members (related and not related). |
| (d) Includes other one family households, multiple family households, group households and households which could not be determined. |
| |
 Quality Declaration
  Print Page
 Print All