ENERGY SOURCES AND USE
Households make a significant contribution to greenhouse gas emissions, accounting for 26% of energy1 use in Australia (ABS 2011). Given that most of Victoria's energy is generated from brown coal, (widely regarded as one of the more greenhouse gas intensive energy sources in use), the use of energy in domestic settings has been a major area of focus amongst Australian governments as a way of promoting sustainable outcomes.
The Department of Climate Change and Energy Efficiency (DCCEE) have identified the promotion of renewable energy and energy efficiency as key strategies in the mitigation of the risks associated with climate change (DCCEE 2012).
At the state level the Department of Primary Industries introduced the Victorian Renewable Energy Target (VRET) scheme as a market based measure aimed at increasing the share of electricity consumption in Victoria from renewable energy sources. The VRET scheme was announced in June 2006 with a target of 10% renewable electricity by 2016 (DPI 2012) .
This chapter explores the sources of energy used by Victorian households.
ENERGY SOURCES
Victorians used a number sources of energy in the household, the most common being mains electricity and mains gas.
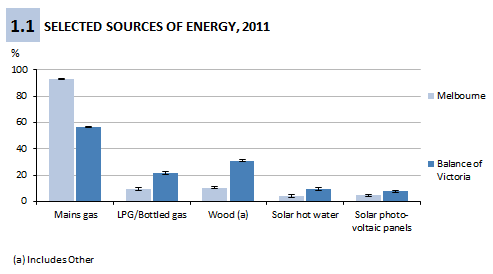
A larger proportion of households used mains gas as a source of energy in Melbourne (93%) compared to Balance of Victoria (56%). Balance of Victoria however had a higher proportion of use of LPG/Bottled Gas (22%) compared with Melbourne (10%) (Figure 1.1).

All graphs in this publication are presented with error bars representing a 95% confidence interval. For more information on how these are calculated see the Technical Note.
In Melbourne, flats, units or apartments or other dwellings were less likely to have mains gas (80%) than separate houses and flats, units or apartments (both 96%). In the Balance of Victoria mains gas was used by nearly three quarters (72%) of semi-detached, row, terrace houses or townhouses, and over half of separate houses (56%) and flats, units or apartments (54%).
Households in Balance of Victoria were more likely to use solar as a source of energy compared to households in Melbourne. In Balance of Victoria 9% of households had solar hot water and 8% had solar photo-voltaic panels. In Melbourne 4% of households had solar hot water and 5% had solar photo voltaic-panels.
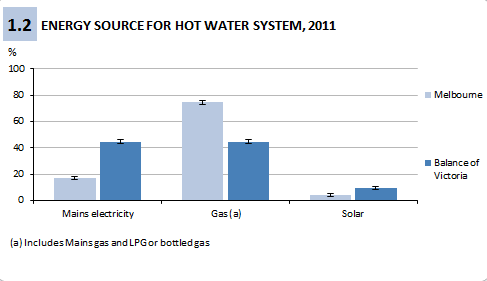
The majority of households in Melbourne use gas hot water systems (74%) (Figure 1.2). In Balance of Victoria mains electricity hot water systems (45%) had similar level of use as gas hot water systems (45%).

Across Victoria, North Eastern Melbourne Statistical Region (SR) had the highest usage of gas hot water systems (81%), while the lowest proportion of gas usage was in All Gippsland SR (34%).
In Victoria 8% of households had purchased or replaced a hot water system in the past 12 months. Households that used solar as a source of energy (16%) for the hot water system were more likely than households that used mains electricity (7%) or gas (8%) to have replaced or purchased their system in the past 12 months.
Footnotes
1. Includes physical use of land transport fuels (petrol, diesel and LPG).
 |
References
ABS (Australian Bureau of Statistics) 2011,
Energy Account, Australia, 2009-10, cat. no. 4604.0, ABS, Canberra
DCCEE (Department of Climate Change and Energy Efficiency) 2012,
DCCEE Strategic Intent 2012-2015
<
http://www.climatechange.gov.au/en/about/strategic-intent.aspx>, viewed 28th June 2012
DPI (Department of Primary Industries) 2012,
Energy in Victoria,
<
http://www.dpi.vic.gov.au/energy> last viewed 5th June 2012
 Print Page
 Print All