|
|

RECEIPT OF ASSISTANCE
In 2009, there were a number of new questions asked about the need for assistance. One of the primary objectives was to understand the degree to which people with disability who needed help, were actually receiving this help. The other objective was to understand who needed more help than they were currently receiving.
ARE MORE PEOPLE RECEIVING HELP THAN IN 2003?
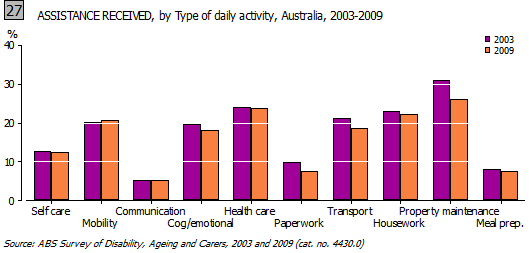
There was an overall decrease in the receipt of assistance between 2003 and 2009 across the ten task areas (Graph 27), an expected result given the fall in prevalence of disability. The following differences were statistically significant:
- receipt of assistance with cognitive or emotional tasks decreased from 2003 (20%) to 2009 (18%);
- receipt of assistance with paperwork decreased from 2003 (10%) to 2009 (8%);
- receipt of assistance with transport decreased from 2003 (21%) to 2009 (19%); and
- receipt of assistance with property maintenance decreased from 2003 (31%) to 2009 (26%).
There was a slight increase in the receipt of assistance for mobility, but this was not statistically significant.
TO WHAT EXTENT WERE PEOPLE RECEIVING HELP?
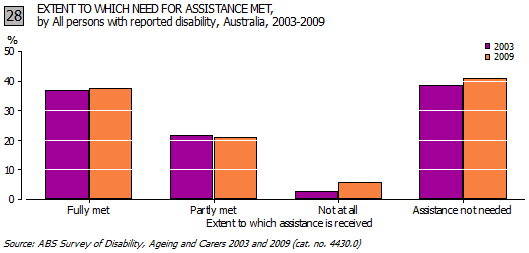
There was little difference reported in the receipt of assistance between 2003 and 2009 (Graph 28):
- a marginally greater proportion of people with disability reported that their need for assistance had been fully met in 2009 (38%) compared to 2003 (37%); and
- more people in 2009 reported that, although they had disability, they did not need assistance (41%) compared to 39% in 2003.
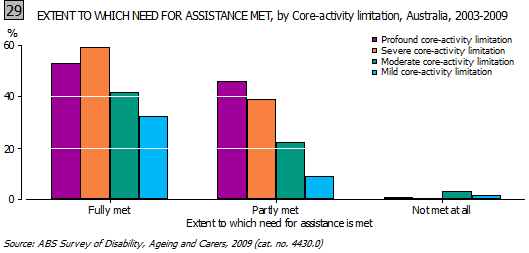
The pattern for receipt of assistance in 2009 was of interest (Graph 29):
- people with more severe forms of disability were more likely to report that their needs were fully met but also more likely to report that their needs were only partially met. For example, of all people with profound core-activity limitation, 53% reported that their needs were fully met while 46% reported that their needs were only partially met; and
- people with mild core-activity limitation reported significantly lower rates of having their needs met: 32% said that their needs were fully met and 9% said their needs were partially met.
WHO IS PROVIDING THIS HELP?
Where a person has a disability that requires need for assistance, there are often a range of sources from which this help is accessed. In 2009, of all people with disabilities receiving assistance, 87% received help from informal sources and 59% received help from formal sources (people may receive assistance from a number of different sources simultaneously).
Informal providers of assistance
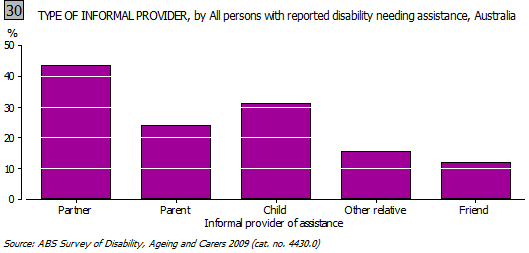
Providers of informal assistance (Graph 30) were typically close family members. In the case of adults with disabilities, this was most likely to be partners (41%) or children (28%) while parents (18%) were more likely to be providing help with children, regardless of their age (many elderly parents provide assistance to adult children).
Reliance on informal assistance from family and friends was particularly noticeable for the three core-activities (Graph 31):
- of all those receiving informal assistance with self-care, 51% received this help from partners and 23% from parents;
- of all those receiving assistance with mobility, 44% received help from partners, 27% from children and 18% from parents; and
- of all those receiving assistance with communication, 64% received help from their parents.
 |
Close family members also tended to provide the most informal assistance with non-core activities (Graph 32):
- partners provided the greatest amount of assistance in most of the non-core activities;
- parents provided the most assistance for cognitive or emotional tasks (40%); and
- children tended to provide less help for cognitive or emotional tasks and health care than partners or parents, but next to partners, provided the most help with paperwork (30%), household chores (28%), property maintenance (31%) and meal preparation (29%).
|

Formal providers of assistance
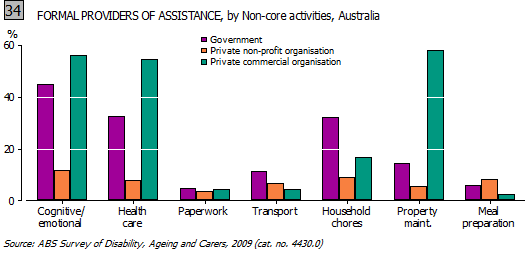
Formal providers of assistance comprised a mix of government, private non-profit organisations and private commercial organisations. The government provided most formal assistance for both core-activities (Graph 33) and non-core-activities (Graph 34). It is likely that many private commercial agencies also received funding from the government.
While the government provided the bulk of assistance with most activities, private commercial agencies provided more assistance with cognitive emotional tasks (56%), health care (55%) and property maintenance (58%). Private non-profit agencies also provided more assistance than private commercial organisations with self-care tasks (5%), mobility (5%) transport (7%) and meal preparation (9%).

UNMET NEED FOR ASSISTANCE
Looking specifically at unmet need for assistance with core activities (self-care, mobility and communication) an interesting change occurred between males and females. In childhood (0-14 years), males were more likely to be reported as needing more assistance with these activities than females (28% and 21% respectively) (Graph 35). For older people however, the situation reversed. From the age of about 35 years onwards, females were more likely to report needing more assistance with these activities than males. The gap between the sexes widened with increasing age. |

|
|
 Print Page
 Print All
 Print Page
 Print All