Microdata and TableBuilder: Australian Health Survey: Nutrition and Physical Activity

Data from the National Nutrition and Physical Activity Survey 2011-12 component of the Australian Health Survey 2011-13

Introduction

This publication presents information about the Australian Health Survey conducted by the Australian Bureau of Statistics (ABS) in 2011-12. Specifically it contains information about the Australian Health Survey product that presents microdata from the National Nutrition and Physical Activity Survey (NNPAS), 2011-12 component of the Australian Health Survey in the form of a TableBuilder dataset, a basic confidentialised unit record file (CURF) and an expanded CURF. The microdata include detailed information on both the Nutrition and Physical Activity components, as well as biomedical information from the National Health Measures Survey (NHMS) of the AHS for NNPAS respondents who agreed to participate.

The aim of this publication is to assist users of the microdata to better understand both the nature of the survey and its potential shortcomings in meeting their data needs. A list of output data items currently available for the TableBuilder and the CURFs can be found on the Downloads tab of this publication.

Information about the design and conduct of the Australian Health Survey in general is also presented.

Available products

The following microdata products are currently available from this survey: 

  • TableBuilder is an online tool for creating tables and graphs and can be accessed via the ABS website.
  • Basic CURF allows approved users access in the user's own environment (via a CD-ROM), as well as via the Remote Access Data Laboratory(RADL) and the DataLab.
  • Expanded CURF allows approved users access via the RADL and the DataLab.

To apply for access to microdata products, follow the instructions via the Microdata Entry Page.

Information on additional products can be found on the Release Schedule page in Australian Health Survey: Users' Guide (cat. no. 4363.0.55.001).

Further information

Further information about the survey and the microdata products can be found in this product:

  • detailed lists of data items for the TableBuilder and the CURFs are available in the Data downloads section
  • information on how to use these products can be found in the left navigation menu
  • the Quality Declaration can be found in the Quality declaration section.

Support

For support in the use of the microdata products, please contact Microdata Access Strategies on 02 6252 7714 or via microdata.access@abs.gov.au.

Data available on request

Data obtained in the survey but not presented in the microdata may be available from the ABS, on request, as statistics in tabulated form.

Subject to confidentiality and sampling variability constraints, special tabulations can be produced incorporating data items, populations and geographic areas selected to meet individual requirements. These are available on request, on a fee for service basis. Contact the National Information and Referral Service on 1300 135 070 or client.services@abs.gov.au for further information. The ABS Privacy Policy outlines how the ABS will handle any personal information that you provide to us.

Survey methodology

The National Nutrition and Physical Activity Survey (NNPAS) 2011-12, is a component survey of the broader 2011-12 Australian Health Survey (AHS). The last National Nutrition Survey was conducted in 1995 as a joint project between the ABS and the then Commonwealth Department of Health and Family Services. The Physical Activity component of the NNPAS (which includes sedentary behaviours and pedometer steps) has not previously been collected in its current form.

The NNPAS was conducted between 29 May 2011 and 9 June 2012 in around 9,500 private dwellings selected throughout non-very remote areas of Australia. In each selected household, general demographic information (including age, sex, marital status and country of birth) was collected on all persons, and detailed information was collected from one adult and one child aged 2-17 years. A total of 12,153 persons participated in the survey.

Detailed information on the design and operation of the National Nutrition and Physical Activity Survey, 2011-12 can be found in the Survey Design and Operation chapter of the Australian Health Survey: Users’ Guide (cat. no. 4363.0.55.001).

File structure

Information from the survey was stored electronically in the form of data items. In some cases items were formed directly from individual survey questions, while in others, items were derived from answers to several questions (e.g. Body Mass Index derived from measured height and weight). Some items were derived with reference to information from other organisations such as the Department of Health (e.g. in relation to guidelines on time undertaking physical activity per week).

The data items and related output categories currently available for the National Nutrition and Physical Activity Survey TableBuilder database, Basic CURF and Expanded CURF are available in Excel spreadsheet format from the Data downloads section of this product.

The following table shows the levels available in each microdata product and the information contained on those levels:

 TableBuilderBasic CURFExpanded CURFInformation contained on level
1. Household levelX XGeographic classifications, household size and structure and household income details
2. Persons in household levelX XBasic demographic and relationship details of all members of households, including selected persons
3. Person levelXXXDemographic and socio-economic characteristics of survey respondents, and much of the physical activity, nutrition and health information. For the Basic CURF only, this level contains geographic classifications and household details.
4. Condition levelX XSelected health conditions reported by respondents
5. Child 2-4 years physical activity day levelX XPhysical and sedentary activities undertaken on the seven days prior to interview for children aged 2-4 years
6. Child 5-17 years physical activity day levelX XPhysical and sedentary activities undertaken on the seven days prior to interview for children aged 5-17 years
7. Child 5-17 years physical activity detailedX XDetailed information about the physical activities undertaken each day on the seven days prior to interview for children aged 5-17 years
8. Adult physical activity levelX XDetailed information about the physical activities undertaken for persons aged 18 years and over
9. Pedometer levelX XNumber of steps and time wore the pedometer for up to eight days reported by the respondents
10. Biomedical levelXXXPathology test information for markers of chronic disease such as blood sugar levels, cholesterol and kidney function, markers of nutritional status, as well as markers of exposure to chemicals such as nicotine
11. Food levelX(a)XXFood intake details on the day prior to the interview and on a second day for respondents that completed the follow-up interview (CATI)
12. Supplement levelX(a)XXDietary supplement intake details on the day prior to the interview and on a second day for respondents that completed the follow-up interview (CATI)
13. ADG level XXAustralian Dietary Guidelines (ADG) items including: day number for intake, food group, ADG food source inclusions and serve amount
  1. The TableBuilder product does not contain Day 2 (CATI) nutrition data on the Person/Food/Supplement levels or nutrient information on the Food or Supplement levels. See the TableBuilder Data item list located in the Data downloads section for the nutrition content available in this product.

Datasets from the Australian Health Survey are hierarchical in nature. A hierarchical data file is an efficient means of storing and retrieving information which describes one to many, or many to many, relationships. For information on the structure of individual microdata products, see the Using the TableBuilder, Using the Basic CURF and Using the Expanded CURF sections within this product.

Using TableBuilder

Instructions on how to use TableBuilder can be found in the User Manual: TableBuilder (cat. no. 1406.0.55.005) and via the help links within the product itself.

For support in the use of TableBuilder and analysis of the data generated from TableBuilder, please contact Microdata Access Strategies on 02 6252 7714 or via microdata.access@abs.gov.au.

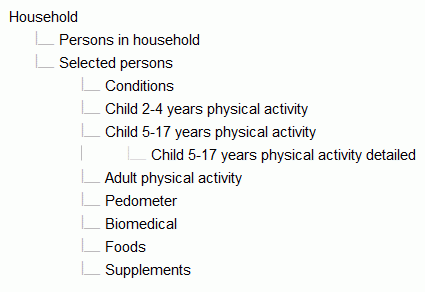
As discussed on the File Structure section of this product, this survey is hierarchical in nature. For the TableBuilder the following structure is in place:

File Structure page

Note on continuous items 

Some continuous data items are allocated special codes for certain responses (e.g. 9999 = 'Not applicable'). When creating ranges for such continuous items for use in the TableBuilder, these special codes will NOT be included in these ranges (any special codes for continuous (summation) data items are listed in the Data Item List and will be found in the categorical version of the continuous item). However, note that labelling of 0s in the DIL does not necessarily mean they are excluded from the ranges (for example - identifying 0 as 'Did not visit' or 'Did not do') as they may still be important in some calculations. Reference should be made to the categorical version of the item to identify which codes are specifically excluded. Therefore the total shown only represents 'valid responses' of that continuous data item rather than all responses (including special codes).

For example:
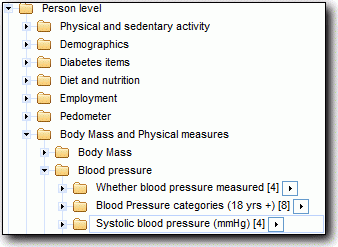
Systolic Blood Pressure is located both in the Person level folder...

Person level folder

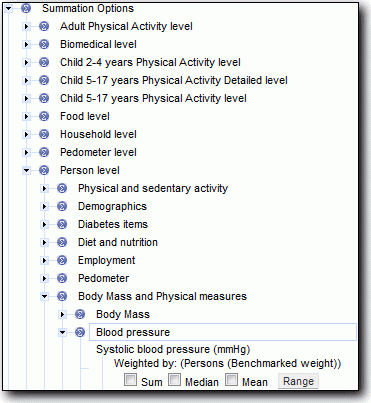
...and the Summation Options.

Summation Options

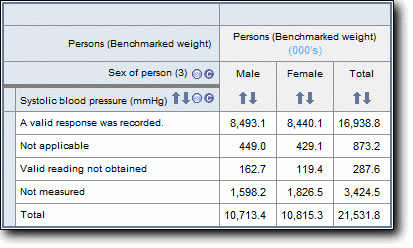
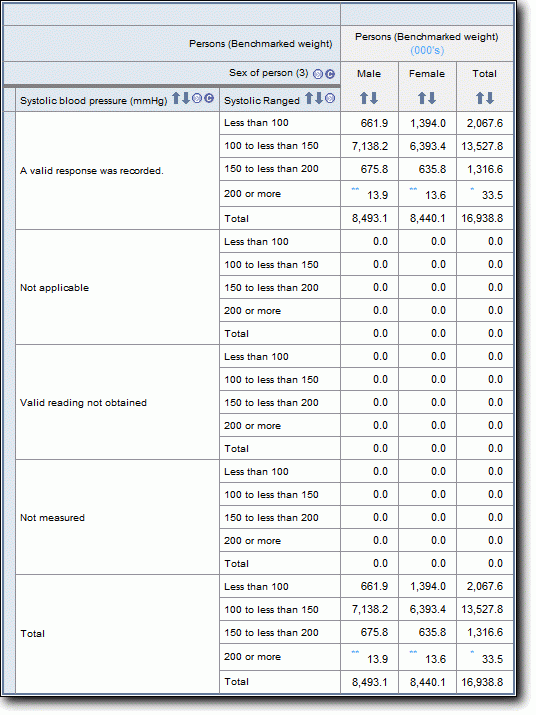
The following table shows the responses for 'Systolic Blood Pressure' by 'Sex of person'. The continuous values of the data item are contained in the 'A valid response was recorded' row. If the actual continuous values are to be displayed, then it is necessary to create a range for them. For information on constructing ranges see the User Manual: TableBuilder (cat. no. 1406.0.55.005).

Table shows the responses for 'Systolic Blood Pressure' by 'Sex of person'

Here is the same table with a range applied for the continuous values of 'Systolic Blood Pressure' (Systolic Ranged). Note that the numbers of respondents for the other responses 'Not applicable', 'Valid reading not obtained' and 'Not measured' no longer contribute to the table.

Table with a range applied for the continuous values of 'Systolic Blood Pressure' (Systolic Ranged)

Any special codes for continuous data items are listed in the Data Item List.

Continuous items can be used to create custom categories in 'My Custom Data' by first ranging the item. For example, to create five year age groupings, this can be done by ranging the item with a five year increment. However, to deviate from groupings of equal increments, this must be done in 'My Custom Data'. As age is a continuous item, it must first be ranged (for example in one year increments) and then this ranged item can be grouped under the 'My Custom Data' tab to form unique age categories. For more information, see the 'My Custom Data' section of the User Manual: TableBuilder (cat. no. 1406.0.55.005).

Confidentiality features in TableBuilder

In accordance with the Census and Statistics Act 1905, all the data in TableBuilder are subjected to a confidentiality process before release. This confidentiality process is undertaken to avoid releasing information that may allow the identification of particular individuals, families, households, dwellings or businesses.

Processes used in TableBuilder to confidentialise records include the following: 

  • perturbation of data
  • table suppression
  • field exclusion rules.

Perturbation of data

To minimise the risk of identifying individuals in aggregate statistics, a technique is used to randomly adjust cell values. This technique is called perturbation. Perturbation involves small random adjustments of the statistics and is considered the most satisfactory technique for avoiding the release of identifiable statistics while maximising the range of information that can be released. These adjustments have a negligible impact on the underlying pattern of the statistics.

The introduction of these random adjustments result in tables not adding up. While some datasets apply a technique called additivity to give internally consistent results, additivity has not been implemented on this TableBuilder. As a result, randomly adjusted individual cells will be consistent across tables, but the totals in any table will not be the sum of the individual cell values. The size of the difference between summed cells and the relevant total will generally be very small.

Please be aware that the effects of perturbing the data may result in components being larger than their totals. This includes determining proportions.

Table suppression

Some tables generated within TableBuilder may contain a substantial proportion of very low counts within cells (excluding cells that have counts of zero). When this occurs, all values within the table are suppressed in order to preserve confidentiality. The following error message below is displayed at the bottom of the table when table suppression has occurred.

ERROR: The table has been suppressed as it is too sparse
ERROR: table cell values have been suppressed

Field exclusion rules

Certain groups of similar variables are restricted from being used together in a table. These restrictions are referred to as field exclusion rules, and are in place in order to protect confidentiality. The collection of similar variables restricted in this way are called field exclusion groups.

For the Australian Health Survey, there is one field exclusion group. This consists of the 2006 and 2011 geographical and Socio-Economic Indexes for Areas (SEIFA) data items (see below for items).

Only one data item from this group may be used in a single table.

The geographic exception to this is the State or Territory item, which can be used in addition to one item from this group.

Items included in the field exclusion group are:

2006 Geographic Items
  • ASGC remoteness area categories
  • Capital city and balance of state
  • Section of state
2011 Geographic Items
  • Remoteness area categories ASGS 2011
  • Greater Capital City Statistical Areas ASGS 2011
  • Section of state ASGS 2011
  • Medicare Locals
  • Peer Groups (MLs)
  • Primary Health Network
2006 SEIFA Items
  • Index of Economic Resources - 2006 - CD - Deciles - National
  • Index of Economic Resources - 2006 - CD - Deciles - State
  • Index of Economic Resources - 2006 - SLA - Deciles - National
  • Index of Economic Resources - 2006 - SLA - Deciles - State
  • Index of Education and Occupation - 2006 - CD - Deciles - National
  • Index of Education and Occupation - 2006 - CD - Deciles - State
  • Index of Education and Occupation - 2006 - SLA - Deciles - National
  • Index of Education and Occupation - 2006 - SLA - Deciles - State
  • Index of Relative Socio-economic Advantage and Disadvantage -2006 - CD - Deciles - National
  • Index of Relative Socio-economic Advantage and Disadvantage - 2006 - CD - Deciles - State
  • Index of Relative Socio-economic Advantage and Disadvantage - 2006 - SLA - Deciles - National
  • Index of Relative Socio-economic Advantage and Disadvantage - 2006 - SLA - Deciles - State
  • Index of Relative Socio-economic Disadvantage - 2006 - CD - Deciles - National
  • Index of Relative Socio-economic Disadvantage - 2006 - CD - Deciles - State
  • Index of Relative Socio-economic Disadvantage - 2006 - SLA - Deciles - National
  • Index of Relative Socio-economic Disadvantage - 2006 - SLA - Deciles - State
2011 SEIFA Items
  • Index of Economic Resources - 2011 - SA1 - Deciles - National
  • Index of Economic Resources - 2011 - SA1 - Deciles - State
  • Index of Economic Resources - 2011 - SA2 - Deciles - National
  • Index of Economic Resources - 2011 - SA2 - Deciles - State
  • Index of Education and Occupation - 2011 - SA1 - Deciles - National
  • Index of Education and Occupation - 2011 - SA1 - Deciles - State
  • Index of Education and Occupation - 2011 - SA2 - Deciles - National
  • Index of Education and Occupation - 2011 - SA2 - Deciles - State
  • Index of Relative Socio-economic Advantage and Disadvantage - 2011 - SA1 - Deciles - National
  • Index of Relative Socio-economic Advantage and Disadvantage - 2011 - SA1 - Deciles - State
  • Index of Relative Socio-economic Advantage and Disadvantage - 2011 - SA2 - Deciles - National
  • Index of Relative Socio-economic Advantage and Disadvantage - 2011 - SA2 - Deciles - State
  • Index of Relative Socio-economic Disadvantage - 2011 - SA1 - Deciles - National
  • Index of Relative Socio-economic Disadvantage - 2011 - SA1 - Deciles - State
  • Index of Relative Socio-economic Disadvantage - 2011 - SA2 - Deciles - National
  • Index of Relative Socio-economic Disadvantage - 2011 - SA2 - Deciles - State

Weight variables

There are three weight variables visible on the TableBuilder file under Summation Options categories:

  • Households (Benchmarked Weight) - located on the Household level. This weight has been benchmarked to produce household estimates.
  • Persons (Benchmarked weight) - located on the Person level. This weight has been benchmarked to produce Australian population estimates for persons aged 2 years and over.
  • Biomedical persons (Benchmarked weight) - located on the Biomedical level. This weight has been benchmarked to produce Australian population estimates based on Biomedical participants aged 5 years and over. For more details on this weight, see below.
Using weights

The NNPAS is a sample survey. To produce estimates for the in-scope population you must use weight fields in your tables. If you do not select a weight field, TableBuilder will use 'Persons (Benchmarked weight)' by default. This will give you estimates of the number of persons. To produce estimates of the number of households, you would have to change the weight field to 'Households (Benchmarked weight)' by adding it to your table from the Household level under Summation Options.

The Household Weight was benchmarked to the Household Level while the Person Weight was benchmarked to the Person level. To produce estimates for NNPAS persons who participated in the National Health Measures Survey (NHMS), the 'Biomedical persons (Benchmarked weight)' located on the Biomedical level must be used. When using a Weight/Summation from a level that is different to that of the variables in the table, please be careful in interpreting the results.

Level of Data itemExplanation of Estimates if use Person Weight for applicable population
1. Household levelPersons in households with the specified characteristics.
2. Persons in household levelPersons in households containing one or more persons with the specified characteristics.
3. Person levelPersons with the specified characteristics.
4. Condition levelPersons with one or more conditions with the specified characteristics.
5. Child 2-4 Years Physical Activity levelPersons with one or more physical activity days with the specified characteristics.
6. Child 5-17 years Physical Activity levelPersons with one or more physical activity days with the specified characteristics.
7. Child 5-17 years Physical Activity Detailed levelPersons with one or more physical activity types with the specified characteristics.
8. Adult Physical Activity levelPersons with one or more physical activity types with the specified characteristics.
9. Pedometer levelPersons with one or more pedometer days with the specified characteristics.
10. Biomedical levelPersons with the specified biomedical characteristics.
11. Food levelPersons with one or more food days with the specified characteristics.
12. Supplement levelPersons with one or more supplement days with the specified characteristics.

Note that the Biomedical level contains non-biomedical participant records, however their biomedical weight is set to 0 so they will not contribute to estimates when the Biomedical persons (Benchmarked weight) is used. However, if the Persons (Benchmarked weight) is used with biomedical data items, then these non-participants will contribute to estimates. When using biomedical variables in conjunction with other variables on the Biomedical level or with variables from other levels, the Biomedical persons (Benchmarked weight) should be used.

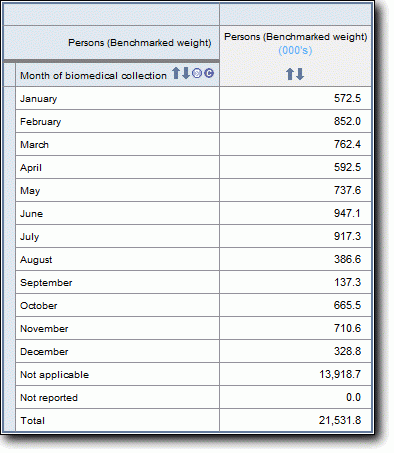
For example, a table of reported 'Month of biomedical collection' using the 'Persons (Benchmarked weight)' will show the 'Month of biomedical collection' for the entire National Nutrition and Physical Activity Survey. Note that the 'Not applicable' persons include those people who did not participate in the NHMS. The population for this table presents the weighted estimates for the population aged 2 years and over.

Table of reported 'Month of biomedical collection' using the 'Persons (Benchmarked weight)'

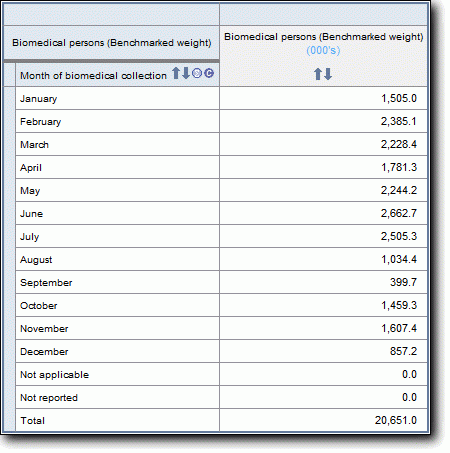
The same table using the 'Biomedical persons (Benchmarked weight)' will show the 'Month of biomedical collection' for only persons who participated in the NHMS. Note that in this case, no-one is in the 'Not applicable' category. People who did not participate in the biomedical component do not have a biomedical person weight and therefore do not contribute to the table when this weight is used. The biomedical population now presents weighted estimates for persons aged 5 years and over.

Table using the 'Biomedical persons (Benchmarked weight)'

You can use a weight field with classificatory fields from other levels, but should take care when interpreting the results. Below are some examples which you can use as a guide.

Weight FieldClassificatory FieldRelative Position of Data to WeightExample Estimate
Persons (Benchmarked weight)State or TerritoryAboveNumber of persons in NSW
Persons (Benchmarked weight)Sex of PersonSameNumber of Males
Persons (Benchmarked weight)Type of ActivityBelowNumber of persons who have participated in that activity type at least once

Means and medians

Means, medians and sums of continuous data items are automatically calculated at the level of the continuous data item. Due to current functionality of the software, a weight from another level cannot be brought into such calculations. The "subject" of means, medians and sums calculated in TableBuilder is therefore the statistical unit associated with the level of the database on which the continuous data item is stored. The weights used for these calculations are not visible, other than on the Person level, but are referenced in the 'Weighted by' statement with continuous variables, as per:

Means, medians and sums of continuous data items are automatically calculated at the level of the continuous data item.

Means, medians and sums across levels

Means, medians and sums of continuous items are automatically weighted before the mean, median or sum is calculated. As TableBuilder only allows one weight to be included in a table, all other items in the table will inherit the weight applied to the mean, median or sum. This has implications when using means, medians and sums from one level with items from another level. For example, if you cross tabulate "Weighted mean of Age" (a Person level data item) with "Total cholesterol status (mmol/L)" (a Biomedical level data item), the default weight applied to the table will be "Persons (Benchmarked Weight)" because this weight is automatically included in the mean "Age of person" calculation. As a result, the biomedical item, "Total cholesterol status (mmol/L)" will also be weighted to "Persons (Benchmarked Weight)" not "Biomedical Persons (Benchmarked Weight)".

Items located on multiple levels

Where items are available on more than one level, an additional number is added to the label to indicate the level version. For example, a (1) indicates it is a Household level version, a (2) indicates a Persons in household level version, a (3) indicates a Person level version, and so on. These are identified in the Data item list labelling as well as the item in TableBuilder. The numbering is based on the ordering of levels found in the File Structure section of this product.

Care should be used to ensure the correct version of the item is used, particularly with regards to demographic items located on both the Persons in household and Person levels. See below for more details.

Persons in household level vs person level items

The Persons in Household level contains data for every person in the household while the Persons level only contains data for the selected persons. Both levels are children of the Household level - that is, they are siblings and are not linked by person but by household (see the File structure page of this product for further information on structure). This means that there is a many-to-many link between records at these levels (persons on the Person level are linked to all the people in their household on the Persons in household level). When summing the Person weight (which is stored at the Person level) the meaning of the estimates produced when disaggregating by another data item at the Person level will not be the same as the meaning of the estimates produced when disaggregating by a data item at the Persons in Household level.

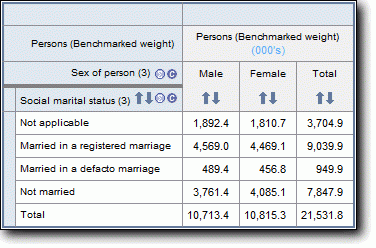
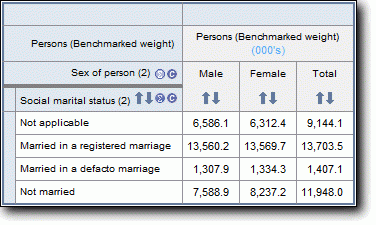
For example, disaggregating by Sex and Marital status at the Person level will produce estimates of the type "Number of persons who are Male and Married". These estimates will be additive (aside from the effects of perturbation) as shown below.

TableBuilder: Persons in household level vs person level items

On the other hand, disaggregating by Sex and Marital status at the Persons in Household level, and using the Persons (Benchmarked weight) from the Person level, will produce estimates of the type "Number of persons in households containing one or more persons who are Male and Married". These estimates will usually not be additive, as shown below.

TableBuilder: Persons in household level vs person level items

Using the Basic CURF

About the Basic CURF

The NNPAS 2011–12 Basic CURF contains unit records relating to all of the survey respondents. The data are released under the Census and Statistics Act 1905, which has provision for the release of data in the form of unit records where the information is not likely to enable the identification of a particular person or organisation. Accordingly, there are no names or addresses of survey respondents on the CURF and other steps, including the following list of actions, have been taken to protect the confidentiality of respondents:

  • the level of detail of many data items has been reduced by grouping, ranging or top coding values
  • some unusual records have been changed to protect against identification
  • excluding some data items that were collected
  • income data has been perturbed.

The nature of the changes made, and the relatively small number of records involved ensure that the effects on data for analysis purposes is considered negligible.

The changes mean that estimates produced from the CURF may differ from those published in Australian Health Survey: Nutrition First Results - Foods and Nutrients (cat. no. 4364.0.55.007) or subsequent publications.

Detailed information about the data collected, comments regarding data quality and other points to assist in using and interpreting the data are contained in Australian Health Survey: Users' Guide (cat. no. 4363.0.55.001). It is recommended that relevant parts of the guide be read in conjunction with the use of the NNPAS 2011-12 Basic CURF.

Counting units and weights

Number of records by level, NNPAS 2011-12 Basic CURF
LEVELSRECORD COUNTS (unweighted)WEIGHTED COUNTS (if applicable)
Person level (Selected persons)12 15321 526 456
Food level341 897N/A
Supplement level25 141N/A
Biomedical level (Persons 5+)12 15320 649 321
Australian Dietary Guidelines level3 102 528N/A

The counting unit for the person level is the (selected) person/s, for the food level it is foods, for the supplement level it is supplements and for the ADG level it is food summaries. There is a weight attached to the person level in order to estimate the total population of the relevant counting unit, in this case persons. The person weight is called NPAFINWT.

Note that only weighted counts on the person level will produce an estimate of the total number of persons with the specified characteristics. This is because the food, supplement and ADG records are repeated for each person. If, for example, NPAFINWT is merged onto the food level, it will be attached to each food record and therefore be repeated for each person. Information should be copied to the person level in order to create weighted estimates. See 'Copying information across levels' below for an example. For more information about weights, see 'Reliability of Estimates' below.

There is also a biomedical weight for the Biomedical level which is called NHMSPERW. Records on this level are benchmarked to the total population aged 5 years and over. Note that this level also contains non-biomedical participant records, however, their biomedical weight is set to 0 so they will not contribute to estimates. When using biomedical data items in conjunction with other items on the biomedical level or with items from other levels, the biomedical weight should be used.

Identifiers

Every record on each level of the file is uniquely identified.

The identifiers ABSPID, ABSFID, ABSSID, ABSBID, ABSLFID and ABSHID appear on all levels of the file. Where the information for the identifier is not relevant for a level, it has a value of 0. See the Data Item List for details on which IDs equate to which levels.

Each person has a unique fourteen digit random identifier, ABSPID. This identifier appears on the person level and is repeated on each level on each record pertaining to that person. On the food level, the item ABSFID sequentially numbers each food record within each person record. The combination of ABSPID and ABSFID uniquely identifies each food record. On the supplement level, the item ABSSID sequentially numbers each supplement record within each person record. The combination of ABSPID and ABSSID uniquely identifies each supplement record. On the Australian Dietary Guidelines level, ABSLFID sequentially numbers each ADG summary record within each person record. The combination of ABSPID and ABSLFID uniquely identifies each ADG summary record.

ABSHID uniquely identifies each household, but note that due to the absence of a household level on the Basic CURF, ABSHID is not needed for sorting, merging and/or copying information between the five levels. ABSHID aids in analysis of household characteristics by relating members of the same household.

Copying information across levels

Multi-response items

A number of questions in the survey allowed respondents to provide one or more responses. Each response category for these multi-response data items is treated as a separate data item. On the CURF, these data items share the same identifier (SAS name) prefix but are each separately suffixed with a letter - A for the first response, B for the second response, C for the third response and so on.

For example, the multi-response data item 'Type of diet currently on' has thirteen response categories (excluding not applicable). There are thirteen data items named TYPDIETA, TYPDIETB, TYPDIETC...TYPDIETM. Each data item in the series has a 'Yes' response code and a 'Null' response code indicating that the response was not relevant for the respondent. The example TYPDIET (A--M) places the not applicable response (code 97, where the question was not asked of the respondent) in the first item TYPDIETA. So TYPDIETA has three response codes; the 'Yes' response code of 10 (Weight loss or low calorie diet), the 'Null' response code of 0 and the not applicable code of 97. The remaining items TYPDIETB--M have just the two response codes each. The data item list identifies all multi-response items and lists the corresponding codes with the corresponding response categories.

Note that the sum of individual multi-response categories will be greater than the population applicable to the particular data item as respondents are able to select more than one response.

Reliability of estimates

As the survey was conducted on a sample of private households in Australia, it is important to take account of the method of sample selection when deriving estimates from the CURF. This is particularly important as a person's chance of selection in the survey varied depending on the state or territory in which the person lived. If these chances of selection are not accounted for by use of appropriate weights, the results will be biased. For details on the NNPAS weighting process, see Weighting, Benchmarks and Estimation procedures in Australian Health Survey: Users' Guide (cat. no. 4363.0.55.001).

Each person record has a main weight (NPAFINWT). This weight indicates how many population units are represented by the sample units. When producing estimates of sub-populations from the CURF, it is essential that they are calculated by adding the weights of persons in each category and not just by counting the sample number in each category. If each person's weight were to be ignored when analysing the data to draw inferences about the population, then no account would be taken of a person's chance of selection or of different response rates across population groups, with the result that the estimates produced could be biased. The application of weights ensures that estimates will conform to an independently estimated distribution of the population by age, by sex, etc. rather than to the distributions within the sample itself.

Each person record on the CURF contains 60 replicate weights in addition to the main weight. Replicate weights can be used to calculate measures of sampling error. For details on sampling error calculations and replicate weights, see Technical Note.

Basic CURF files

ASCII text format files

SAS files

SPSS files

STATA files

Information files

Frequency files

Using the Expanded CURF

About the Expanded CURF

The NNPAS 2011–12 Expanded Confidentialised Unit Record File (CURF) contains unit records relating to all of the survey respondents. The data are released under the Census and Statistics Act 1905, which has provision for the release of data in the form of unit records where the information is not likely to enable the identification of a particular person or organisation. Accordingly, there are no names or addresses of survey respondents on the CURF and other steps, including the following list of actions, have been taken to protect the confidentiality of respondents:

  • the level of detail of many data items has been reduced by grouping, ranging or top coding values
  • some unusual records have been changed to protect against identification
  • excluding some data items that were collected
  • income data has been perturbed.

The nature of the changes made, and the relatively small number of records involved ensure that the effect on data for analysis purposes is considered negligible.

The changes mean that estimates produced from the CURF may differ from those published in Australian Health Survey: Physical Activity (cat. no. 4364.0.55.004) or subsequent publications.

Detailed information about the data collected, comments regarding data quality and other points to assist in using and interpreting the data are contained in Australian Health Survey: Users' Guide (cat. no. 4363.0.55.001).

Accessing Expanded CURFs

Expanded CURFs can be accessed via the Remote Access Data Laboratory (RADL) and/or the DataLab. Users must have applied for use of the RADL and/or DataLab prior to using the Expanded CURF microdata.

Counts and weights

Number of records by level, NNPAS 2011-12 Expanded CURF
LEVELSRECORD COUNTS (UNWEIGHTED)WEIGHTED COUNTS (if applicable)
Household level9 5198 581 354
Persons in Household level (All persons)23 464N/A
Person level (Selected persons)12 15321 526 456
Conditions level15 897N/A
Child 2-4 Physical Activity Day level16 203N/A
Child 5-17 Physical Activity Day level24 411N/A
Child 5-17 Physical Activity Detailed level31 789N/A
Adult Physical Activity level13 474N/A
Pedometer level51 341N/A
Biomedical level (Persons 5+)12 15320 649 321
Food level341 897N/A
Supplement level25 141N/A
Australian Dietary Guidelines level3 102 528N/A

Weights and hierarchical files

Weight variables

There are three weight variables on the file:

Household Weight (NPAHHWT) - Household level - Benchmarked
Person Weight (NPAFINWT) - Selected Person level - Benchmarked to the total population aged 2 years and over
Biomedical Weight (NHMSPERW) - Biomedical level - Benchmarked to the total population aged 5 years and over. Note that this level also contains non-biomedical participant records, however, their biomedical weight is set to 0 so they will not contribute to estimates. When using biomedical variables in conjunction with other variables on the biomedical level or with variables from other levels, the biomedical weight should be used.

There is no weight associated with the Persons in household level. This level is available in order to produce compositional information about the household (e.g. Number of persons in household aged 4-14 years) which can then either be used with the household weight to represent for example, the number of households with at least two persons aged 4-14 years, or with the person weight to represent the number of people living in households that contain at least two persons aged 4-14 years.

There is also no weight associated with the other levels. This is because the records are repeated for each person. If, for example, NPAFINWT is merged onto the Conditions level, it will be attached to each condition record and therefore be repeated for each person where they have more than one condition. This should be considered when producing tables. See' Copying information across levels' below for more information.

For more information about weights see 'Reliability of Estimates' below.

Using weights

The NNPAS is a sample survey. To produce estimates for the in-scope population you must use weight fields in your calculations. The 'Biomedical Weight (Benchmarked weight)' must be used for all tables where a biomedical level data item is being used. This includes where biomedical items are being used with items from other levels. Which weight, if any, is used on data at non-benchmarked levels will affect the result as shown in the examples below:

Level of Data ItemEstimates if use Household WeightEstimates if use Person Weight
Household levelHouseholds with the specified characteristics.Persons in households with the specified characteristics.
Persons in Household level (All persons)Households containing one or more persons with the specified characteristics.Persons in households containing one or more persons with the specified characteristics
Person level (Selected persons)Households containing one or more selected persons with the specified characteristics.Persons with the specified characteristics.
Conditions levelHouseholds containing one or more selected persons with one or more conditions with the specified characteristics.Persons with one or more conditions with the specified characteristics.
Child 2-4 Physical Activity Day levelHouseholds containing one or more selected persons with one or more physical activity days with the specified characteristics.Persons with one or more physical activity days with the specified characteristics.
Child 5-17 Physical Activity Day levelHouseholds containing one or more selected persons with one or more physical activity days with the specified characteristics.Persons with one or more physical activity days with the specified characteristics.
Child 5-17 Physical Activity Detailed levelHouseholds containing one or more selected persons with one or more physical activity types with the specified characteristics.Persons with one or more physical activity types with the specified characteristics.
Adult Physical Activity levelHouseholds containing one or more selected persons with one or more physical activity types with the specified characteristics.Persons with one or more physical activity types with the specified characteristics.
Pedometer levelHouseholds containing one or more selected persons with one or more pedometer days with the specified characteristics.Persons with one or more pedometer days with the specified characteristics.
Biomedical level (Persons 5+)Households containing one or more selected persons with one or more specified biomedical characteristics.Persons with the specified biomedical characteristics.
Food levelHouseholds containing one or more persons with one or more food days with the specified characteristics.Persons with one or more food days with the specified characteristics.
Supplement levelHouseholds containing one or more persons with one or more supplement days with the specified characteristics.Persons with one or more supplement days with the specified characteristics.
Australian Dietary Guidelines (ADG) levelHouseholds containing one or more persons with one or more food days with the specified summary characteristics.Persons with one or more food days with the specified summary characteristics.

Identifiers

Every record on each level of the file is uniquely identified.

The identifiers ABSHID, ABSAID, ABSGID, ABSCID, ABSTID, ABSKID, ABSDID, ABSUID, ABSEID, ABSBID, ABSFID, ABSSID and ABSLFID appear on all levels of the file. Where the information for the identifier is not relevant for a level, it has a value of 0. See the Data Item List for details on which IDs equate to which levels.

Each household has a unique thirteen digit random identifier, ABSHID. This identifier appears on the household level and is repeated on each level on each record pertaining to that household. The combination of identifiers uniquely identifies a record at a particular level as shown below.

  1. Household = ABSHID
  2. All Persons in Household = ABSHID, ABSAID
  3. Selected Person = ABSHID, ABSAID, ABSGID
  4. Conditions = ABSHID, ABSAID, ABSGID, ABSCID
  5. Child 2-4 Physical Activity Day = ABSHID, ABSAID, ABSGID, ABSTID
  6. Child 5-17 Physical Activity Day = ABSHID, ABSAID, ABSGID, ABSKID
  7. Child 5-17 Physical Activity Detailed = ABSHID, ABSAID, ABSGID, ABSKID, ABSDID
  8. Adult Physical Activity = ABSHID, ABSAID, ABSGID, ABSUID
  9. Pedometer = ABSHID, ABSAID, ABSGID, ABSEID
  10. Biomedical = ABSHID, ABSAID, ABSGID, ABSBID
  11. Food = ABSHID, ABSAID, ABSGID, ABSFID
  12. Supplement = ABSHID, ABSAID, ABSGID, ABSSID
  13. ADG = ABSHID, ABSAID, ABSGID, ABSLFID

ABSHID assists with linking together people of the same household and also with household characteristics such as geography (located on the household level). The combination of ABSHID ABSAID ABSGID and ABSCID identifies each individual condition record a person has. When merging data with a level above, only those identifiers relevant to the level above are required. However, when merging, for example, the conditions level with the person level, the data on the person level will duplicate for each condition. See 'Copying information across levels' below for more information.

Copying information across levels

Multi-response items

A number of questions in the survey allowed respondents to provide one or more responses. Each response category for these multi-response data items is treated as a separate data item. On the CURF, these data items share the same identifier (SAS name) prefix but are each separately suffixed with a letter - A for the first response, B for the second response, C for the third response and so on.

For example, the multi-response data item 'Type of diet currently on' has thirteen response categories (excluding not applicable). There are thirteen data items named TYPDIETA, TYPDIETB, TYPDIETC...TYPDIETM. Each data item in the series has a 'Yes' response code and a 'Null' response code indicating that the response was not relevant for the respondent. The example TYPDIET (A--M) places the not applicable response (code 97, where the question was not asked of the respondent) in the first item TYPDIETA. So TYPDIETA has three response codes; the 'Yes' response code of 10 (Weight loss or low calorie diet), the 'Null' response code of 0 and the not applicable code of 97. The remaining items TYPDIETB--M have just the two response codes each. The data item list identifies all multi-response items and lists the corresponding codes with the corresponding response categories.

Note that the sum of individual multi-response categories will be greater than the population applicable to the particular data item as respondents are able to select more than one response.

Reliability of estimates

As the survey was conducted on a sample of private households in Australia, it is important to take account of the method of sample selection when deriving estimates from the CURF. This is particularly important as a person's chance of selection in the survey varied depending on the state or territory in which the person lived. If these chances of selection are not accounted for by use of appropriate weights, the results will be biased. For details on the NNPAS weighting process, see Weighting, Benchmarks and Estimation procedures in Australian Health Survey: Users' Guide (cat. no. 4363.0.55.001).

Each person record has a main weight (NPAFINWT). This weight indicates how many population units are represented by the sample units. When producing estimates of sub-populations from the CURF, it is essential that they are calculated by adding the weights of persons in each category and not just by counting the sample number in each category. If each person's weight were to be ignored when analysing the data to draw inferences about the population, then no account would be taken of a person's chance of selection or of different response rates across population groups, with the result that the estimates produced could be biased. The application of weights ensures that estimates will conform to an independently estimated distribution of the population by age, by sex, etc. rather than to the distributions within the sample itself.

Each person record on the CURF contains 60 replicate weights in addition to the main weight. Replicate weights can be used to calculate measures of sampling error. For details on sampling error calculations and replicate weights, see Technical Note.

Expanded CURF files

SAS files

SPSS files

STATA files

Information files

Data item lists

The National Nutrition and Physical Activity Survey 2011-12 collected information using household and personal questionnaires. Users intending to purchase the microdata should ensure that the data they require and the level of detail they need are available in the products.

Complete lists of all data items included on the TableBuilder dataset, the Basic CURF and Expanded CURF, including relevant population and classification details, are available in the Data downloads section.

Each sheet of the data item lists indicates a level of data (e.g. Household level, Person level, Food level, Adult physical activity level) or a grouping of like data about a selected person (e.g. Demographics, Education, Risk factors - nutrition, Physical measures and body mass).

Definitions for data item concepts can be found in the topic pages of the Australian Health Survey: Users' Guide (cat. no. 4363.0.55.001).

Conditions of use

User responsibilities

The Census and Statistics Act 1905 includes a legislative guarantee to respondents that their confidentiality will be protected. This is fundamental to the trust the Australian public has in the ABS, and that trust is in turn fundamental to the excellent quality of ABS information. Without that trust, survey respondents may be less forthcoming or truthful in answering our questionnaires. For more information, see 'Avoiding inadvertent disclosure' and 'Microdata' on our web page How the ABS keeps your information confidential.

TableBuilder

In accordance with the Census and Statistics Act 1905, data in TableBuilder are subjected to a confidentiality process before release. The release of microdata must satisfy the ABS legislative obligation to release information in a manner that is not likely to enable the identification of a particular person or organisation.

This confidentiality process is applied to avoid releasing information that may lead to the identification of individuals, families, households, dwellings or businesses.

Prior to being granted access to TableBuilder, users must agree to the following ABS Terms and Conditions of TableBuilder Access: 

  • understand that the ABS has taken great care to ensure that the information on the survey output record file is correct and as accurate as possible, and understand that the ABS does not guarantee, or accept any legal liability whatsoever arising from, or connected to, the use of any material contained within, or derived from TableBuilder
  • understand that all data extracted from the Survey Output Record File through TableBuilder will be confidentialised prior to being supplied and that as a result, no reliance should be placed on small cells as they are impacted by random adjustment, respondent and processing errors
  • inform the ABS, through their Contact Officer upon leaving their organisation that their access is disabled
  • not to provide their TableBuilder user ID and password access to any other person or organisation.

CURFs

The Census and Statistics Act 1905 allows the Australian Statistician to approve release of unit record data. All CURFs released have been approved by the Statistician. Prior to being granted access to CURFs, each organisation's Responsible Officer must submit a CURF Undertaking to the ABS. The CURF Undertaking is required by legislation and states that prior to CURFs being released to an organisation, a Responsible Officer must undertake to ensure that the organisation will abide by the conditions of use of CURFs. Individual users are bound by the undertaking signed by the Responsible Officer.

All CURF users are required to read and abide by the conditions and restrictions in the Responsible Use of ABS Microdata, User Guide (cat. no. 1406.0.55.003). Any breach of the CURF undertaking may result in withdrawal of service to individuals and/or organisations. Further information is contained in the Consequences of Failing to Comply with a Microdata Undertaking web page.

Conditions of sale

All ABS products and services are provided subject to the ABS Conditions of Sale. Any queries relating to these Conditions of Sale should be referred to intermediary.management@abs.gov.au.

Price

Microdata access is priced according to the ABS Pricing Policy and Commonwealth Cost Recovery Guidelines. For microdata prices, refer to the Microdata Entry Page.

How to apply for access

To apply for access to microdata products, follow the registration instructions which are available via the Microdata Entry Page.

Australian universities

The ABS/Universities Australia Agreement provides participating universities with access to a range of ABS products and services. This includes access to microdata. For further information, university clients should refer to the ABS/Universities Australia Agreement web page.

Futher information

The Microdata Entry page on the ABS website contains links to microdata related information to assist users to understand and access microdata. For further information, users should email microdata.access@abs.gov.au or telephone (02) 6252 7714.

Data downloads

Data files

Quality declaration

Institutional environment

Relevance

Timeliness

Accuracy

Coherence

Interpretability

Accessibility

Previous catalogue number

This release previously used catalogue number 4324.0.55.002.

Back to top of the page