AGE AND SEX
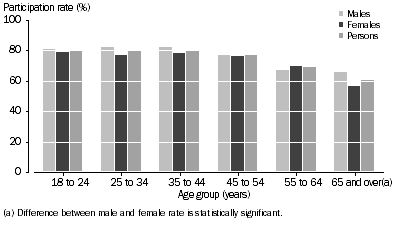
Participation rates in sport and physical recreation activities varied between males and females and between age groups. Overall, male participation was slightly higher than female participation. Of Australia's 8.3 million males aged 18 years and over, 6.3 million participated in sport or physical recreation, representing a participation rate of 76%. In comparison, the female participation rate was 72%, with 6.2 million of the 8.5 million Australian females partaking in sport or physical recreation.
Participation rates in sport and physical recreation showed a general decline for both males and females among older age groups. Among young adults aged 18 to 24 years, 80% participated in sport or physical recreation. In contrast, the participation rate among older Australians aged 65 and over was much lower at 61%. The sharpest drop in participation occurred between the age groups of 45 to 54 years, 55 to 64 years, and 65 years and over, with the participation rate dropping by 8 percentage points between each age group.
4.1 Participation in Sport and Physical Recreation, By age and sex

4.2 Participation in Sport and Physical Recreation, By age and sex |
|
 |  | Participated | Did not participate | Total | Participation rate | Non-participation rate | Total |
 |  | '000 | '000 | '000 | % | % | % |
|
| Males |  |  |  |  |  |  |
 | 18-24 | 908.6 | *213.9 | 1 122.5 | 80.9 | *19.1 | 100.0 |
 | 25-34 | 1 294.4 | 280.3 | 1 574.7 | 82.2 | 17.8 | 100.0 |
 | 35-44 | 1 258.4 | 283.0 | 1 541.4 | 81.6 | 18.4 | 100.0 |
 | 45-54 | 1 140.6 | 340.3 | 1 480.9 | 77.0 | 23.0 | 100.0 |
 | 55-64 | 834.8 | 408.6 | 1 243.4 | 67.1 | 32.9 | 100.0 |
 | 65 and over | 863.7 | 455.2 | 1 318.9 | 65.5 | 34.5 | 100.0 |
 | Total | 6 300.5 | 1 981.3 | 8 281.8 | 76.1 | 23.9 | 100.0 |
| Females |  |  |  |  |  |  |
 | 18-24 | 842.9 | 226.0 | 1 068.9 | 78.9 | 21.1 | 100.0 |
 | 25-34 | 1 204.6 | 365.6 | 1 570.2 | 76.7 | 23.3 | 100.0 |
 | 35-44 | 1 224.7 | 353.2 | 1 577.9 | 77.6 | 22.4 | 100.0 |
 | 45-54 | 1 157.8 | 365.7 | 1 523.5 | 76.0 | 24.0 | 100.0 |
 | 55-64 | 888.6 | 382.9 | 1 271.5 | 69.9 | 30.1 | 100.0 |
 | 65 and over | 839.6 | 654.7 | 1 494.3 | 56.2 | 43.8 | 100.0 |
 | Total | 6 158.2 | 2 348.1 | 8 506.3 | 72.4 | 27.6 | 100.0 |
| Persons |  |  |  |  |  |  |
 | 18-24 | 1 751.5 | 439.9 | 2 191.4 | 79.9 | 20.1 | 100.0 |
 | 25-34 | 2 499.0 | 645.9 | 3 144.9 | 79.5 | 20.5 | 100.0 |
 | 35-44 | 2 483.1 | 636.2 | 3 119.4 | 79.6 | 20.4 | 100.0 |
 | 45-54 | 2 298.4 | 706.0 | 3 004.4 | 76.5 | 23.5 | 100.0 |
 | 55-64 | 1 723.4 | 791.4 | 2 514.9 | 68.5 | 31.5 | 100.0 |
 | 65 and over | 1 703.3 | 1 109.9 | 2 813.2 | 60.5 | 39.5 | 100.0 |
 | Total | 12 458.7 | 4 329.4 | 16 788.2 | 74.2 | 25.8 | 100.0 |
|
| * estimate has a relative standard error of 25% to 50% and should be used with caution |
 Print Page
 Print All
 Print Page
 Print All