WHITEGOODS & TELEVISIONS
The use of appliances such as washing machines, refrigerators and televisions can have a major influence on the rate of energy use and greenhouse gas emissions of the household. Energy efficiency in the home has been identified as a potential 'low-hanging fruit' in the pursuit of a reduced impact by households on total greenhouse gas emissions (SV 2010).
In 2011, energy star ratings have been shown to be considered by around half of all households when purchasing or replacing refrigerators (51%), separate freezers (42%), dishwashers (52%), washing machines (49%) and clothes dryers (53%) (ABS 2011).
As technology evolves televisions are becoming increasingly important contributors to domestic energy use. One in four Australians buy a new television each year, and televisions are now the fourth largest electricity users in our homes after water heating, refrigeration and lighting. A large wide-screen TV can use more energy per day than a family-sized fridge, or more than a dishwasher, clothes washer and dryer combined (DCCEE 2012).
This chapter looks at the prevalence and frequency of use of whitegoods and televisions in Victorian households.
WHITEGOODS
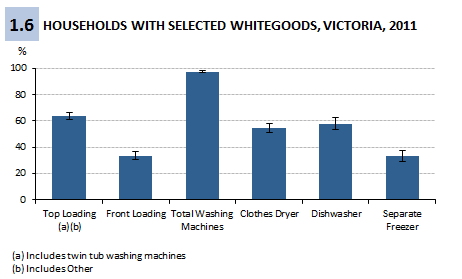
Figure 1.6 shows the proportion of households in Victoria with selected whitegoods. Households were significantly more likely to have Top Loading (64%) than Front loading (34%) washing machines. Slightly more than half of all households had a clothes dryer (55%) and a dishwasher (58%). A third (33%) of all households had a separate freezer.
Washing machines
The proportion of households owning front loading washing machines in Victoria had increased from 28% in 2009 to 34% in 2011. Households in the highest income quintile were more likely to have a front loading washing machine (50%) compared to the lowest quintile (22%) in 2011.
Victorian households in the lowest income quintile were more likely than households in the highest income quintile to use their washing machine less than three times a week (47% and 30% respectively). Nearly half (48%) of households in the highest income quintile used their washing machine three to five time per week, compared with over a third (35%) of households in the lowest income quintile.
Households without children are more likely to use their washing machine less than three times a week (44%) compared to households with children (11%).
Clothes dryers
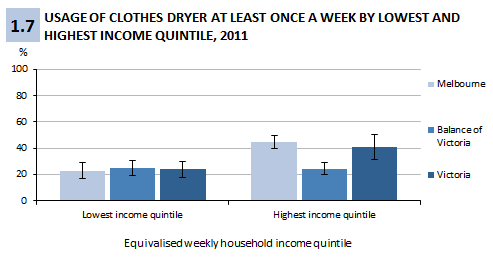
Households in Melbourne with a clothes dryer in the highest income quintile were more likely to use a clothes dryer at least once a week (45%) compared with households in the lowest income quintile (23%) (Figure 1.7).
Dishwashers
The amount of households owning dishwashers in Victoria had increased from 53% in 2009 to 58% in 2011.
In 2011, Victorian households in the highest income quintile were more likely to have dishwashers with 77%, compared to the lowest quintile with 40%.
Households in Melbourne had a higher proportion of dishwashers (61%) compared to those in Balance of Victoria (50%).
Refrigerators
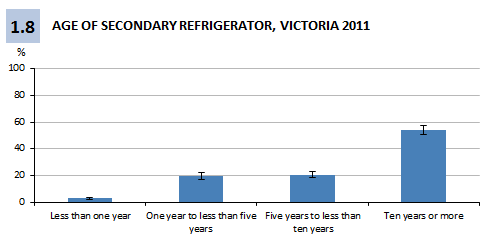
In 2011, 1.6 million Victorian households had only one refrigerator (73%), and 515,500 households had two refrigerators. Of those with second refrigerators, over half (54%) of those refrigerators were aged 10 years or older (Figure 1.8).
Separate freezers
In Victoria 33% of households had separate freezers. Of the households with one refrigerator, 426,400 households had a separate freezer (20%), and of those with two refrigerators 251,800 households had a separate freezer (12%).
Households in Balance of Victoria were more likely to have a separate freezer (52%) compared to Melbourne (25%).
TELEVISIONS
In Victoria, 873,800 households had one television (45%), 769,800 had two televisions (39%) and 317,200 had three televisions (16%) (Figure 1.9).
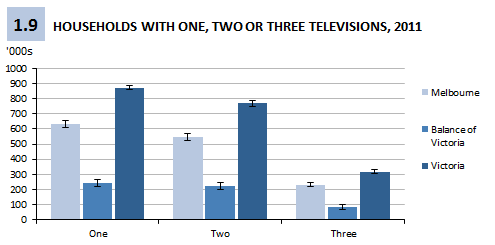
Households that were rented (including free rent) were more likely to have a single television than households that were being paid off (58% and 35% respectively). One in five households (21%) that were being paid off had three televisions, compared with one in ten (9%) of households being rented.
Victorians use many different types of televisions, ranging from picture tube TV (CRT) to LCD, plasma and more. In Victoria the most common type of television was LCD, with just over 1 million (47%) households owning one (Figure 1.10).
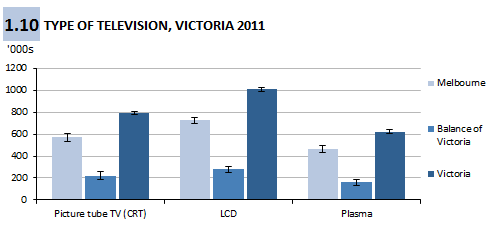
Households in the lowest income quintile were more likely to have a CRT (43%) television compared to the highest income quintile (25%)
References
ABS (Australian Bureau of Statistics) 2011, Environmental Issues: Energy Use and Conservation, Cat. no. 4602.0.55.001, ABS, Canberra.
DCCEE (Department of Climate Change and Energy Efficiency), Think Change
<http://www.climatechange.gov.au/what-you-need-to-know/appliances-and-equipment/televisions.aspx> last viewed 12th June 2012
SV (Sustainability Victoria) 2010, On-ground assessment of the Energy Efficiency Potential of Victorian Homes, Moreland Energy Foundation,
<http://www.sustainability.vic.gov.au/resources/documents/Report_on_On_Ground_Assessment_Pilot_study.pdf> last viewed 2nd July 2012
 Print Page
 Print All
 Print Page
 Print All