|
|
|
This page contains the following further information for a fair go:
|
USEFUL LINKS
ABS Topics @ a Glance - Health
ABS Topics @ a Glance - Labour
ABS Topics @ a Glance - Education and Training
ABS Topics @ a Glance - Personal, Family Household Finances
ABS General Social Survey: Summary Results, Australia, 2010 (cat. no.4159.0)
ABS Schools, Australia, 2012 (cat. no. 4221.0)
ABS Preschool Education, Australia, 2012 (cat. no. 4240.0)
ABS Disability, Ageing and Carers, Australia: Summary of Findings, 2009 (cat. no, 4430.0)
ABS Patient Experiences in Australia: Summary of Findings, 2011-12 (cat. no. 4839.0)
ABS Persons not in the Labour Force, Australia, September 2012 (cat. no. 6220.0)
ABS Education and Work, Australia, May 2012 (cat. no. 6227.0)
ABS Household Expenditure Survey, Australia: Summary of Results, 2009-10 (cat. no. 6530.0)
Relationships Australia <http://www.relationships.org.au/>
|
|
GLOSSARY
Deciles
Groupings that result from ranking all households or persons in the population in ascending order according to some characteristic such as their household income and then dividing the population into 10 equal groups, each comprising 10% of the estimated population.
Disposable income
Gross income less income tax, the Medicare levy and the Medicare levy surcharge i.e. remaining income after taxes are deducted, which is available to support consumption and /or saving. Income tax, Medicare levy and the Medicare levy surcharge are imputed based on each person's income and other characteristics as reported in the survey. Disposable income is sometimes referred to as net income.
Enrolment
A child is considered to be enrolled if they were offered a place in the preschool program and:
- attended the preschool program for a least one hour during the reference period; or
- were absent during the reference period due to illness or extended holiday leave, but were expected to return.
A child is not considered to be enrolled if they were absent during the reference period and not expected to return to the preschool program.
Episode of enrolment/attending a preschool program
An episode is the count of the occurrence of a specific characteristic. For the National Early Education and Care (ECEC) Collection, an episode refers to a preschool program provided to a child. When one child attends two different preschool programs, the child is attending two episodes of preschool.
Equivalised disposable household income
Disposable household income adjusted using an equivalence scale. For a lone person household it is equal to disposable household income. For a household comprising more than one person, it is an indicator of the disposable household income that would need to be received by a lone person household to enjoy the same level of economic wellbeing as the household in question.
Estimated resident population (ERP)
The estimated resident population (ERP) is the official measure of the population of Australia. It is based on the concept of usual residence. For the purpose of ERP, a person is regarded as a usual resident if they have been (or are expected to be) residing in Australia for a period of 12 months or more. As such, it refers to all people, regardless of nationality, citizenship or legal status who usually live in Australia, with the exception of foreign diplomatic personnel and their families.
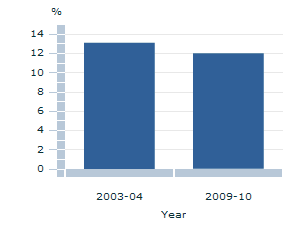
Financial stress
The financial stress questions asked in the Household expenditure survey relate to cash flow problems and financial resources. The nine specific financial stress indicators are:
- household spends more money than it gets (over the last 12 months);
- unable to raise $2,000 in a week to pay for something important;
- could not pay electricity, gas or telephone bills on time;
- could not pay car registration or insurance on time;
- pawned or sold something;
- went with out meals;
- could not afford to heat their home;
- sought assistance from welfare/community organisations; and
- sought financial help from friends or family.
Formal education
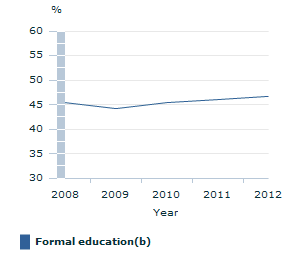
Formal education includes: School Level Education; Higher Education; Vocational Education, and for study for non-school qualification where the level as unable to be determined. Higher education includes: Postgraduate degrees; Master degrees; Graduate diplomas; Graduate certificates and Bachelor degrees. As well as, Vocational Education which includes Advanced diplomas, Diplomas and Certificates I to IV.
Higher education
Education offered by a university or other higher education institution, leading toward the award of a degree of higher level qualification. Higher education includes Postgraduate degrees, Master degrees, Graduate diplomas, Graduate certificates and Bachelor degrees. As well as, Vocational Education includes Advanced diplomas, Diplomas and Certificates I to IV.
Household
A person living alone or a group of related or unrelated people who usually live in the same private dwelling. For the purposes of the National ECEC Collection, is defined as a structured, play-based learning program, delivered by a degree qualified teacher, primarily aimed at children in the year before they commence full-time schooling. This is irrespective of the type of institution that provides it or whether it is government funded or privately provided.
Imputed rent
The estimated market rent that a dwelling would attract if it were to be commercially rented. The addition of net imputed rent allows for more meaningful comparison of the income circumstances of people living in different tenure types. Including imputed rent as part of household income and expenditure conceptually treats owner-occupiers as if they were renting their home from themselves, thus simultaneously incurring rental expenditure and earning rental income. Imputed rent is included in income on a net basis i.e. the imputed value of the services received less the value of the housing costs incurred by the household in their role as landlord. For further information, ABS Household Income and Income Distribution, Australia, 2011-12 (cat. no. 6523.0).
Income
Income consists of all current receipts, whether monetary or in kind, that are received by the household or by individual members of the household, and which are available for, or intended to support, current consumption.
Income includes receipts from:
- wages and salaries and other receipts from employment (whether from an employer or own incorporated enterprise), including income provided as part of salary sacrificed and/or salary package arrangements;
- profit/loss from own unincorporated business (including partnerships);
- net investment income (interest, rent, dividends, royalties);
- government pensions and allowances; and
- private transfers (e.g. superannuation, workers' compensation, income from annuities, child support, and financial support received from family members not living in the same household).
Gross income is the sum of the income from all these sources before income tax, the Medicare levy and the Medicare levy surcharge are deducted. Other measures of income are Disposable income and Equivalised disposable household income.
Note that child support and other transfers from other households are not deducted from the incomes of the households making the transfers.
Low economic resource households (LER Households)
Low economic resource households are those households in the lowest four deciles (i.e 40%) of both equivalised disposable income and equivalised household net worth. People in other households are those who are not in low economic resource households.
Net worth
Net worth is the value of a household's assets less the value of its liabilities. Net worth may be negative when household liabilities exceed household assets.
Preschool program
For the purposes of the National ECEC Collection, is defined as a structured, play-based learning program, delivered by a degree qualified teacher, primarily aimed at children in the year before they commence full-time schooling. This is irrespective of the type of institution that provides it or whether it is government funded or privately provided.
Preschool Participation Rate
Preschool participation rates for the Australian Capital Territory(ACT) are above 100% due to enrolled and attending preschool children from Jervis Bay being included in the statistics for the ACT.
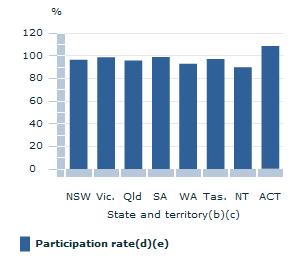
School participation rates for students aged 6-17 in the ACT are above 100% due largely as a result of New South Wales residents from surrounding areas enrolling in ACT schools. School students in Jervis Bay are included in the ACT student totals for these rates (numerator), however, Jervis Bay is classified under 'Other territories' in the Estimated Resident Population series and is only included in the Australian totals for the denominator.
Qualification
Formal certification, issued by a relevant approved body, in recognition that a person has achieved an appropriate level of learning outcomes or competencies relevant to identifies individual, professional, industry or community needs. Statements of attainment awarded for partial completion of a course of study at a particular level are excluded.
School Participation Rate (SPR)
This is a measure of the number of school students of a particular age expressed as a proportion of the Estimated Resident Population of the same age. It indicates the proportion of the population by age who are at school. See Explanatory Notes for further information.
Socio-economic status (SES)
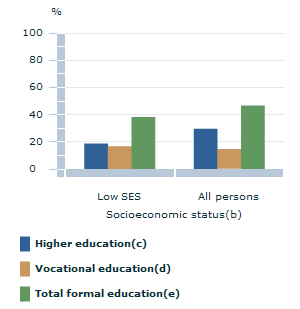
Socio-economic status is derived using the ABS 2006 SEIFA IRSD (at CD level) disaggregated into quintiles (where 1 is the most disadvantaged and 5 is the least disadvantaged). Low SES represents Quintile 1.
|
|
There are no references for this theme
|
Click on the links below to be taken to a summary of the graphs from the corresponding tab within the A fair go theme:
Meeting basic needs
Education, training and information
Employment
Income
|
| MEETING BASIC NEEDS |
 |
Households that have low economic resources & have experienced one or more financial stressors |
 |  |  |
 |  |  |
Progress indicator |  |  |
Source:
ABS data available on request, Household Expenditure Survey |  |  |
 |  | |
 |  |  |
 |  |  |
|
| EDUCATION, TRAINING AND INFORMATION |
 |
Participation rates in education(a) |
 |  |  |
 |  |  |
Progress indicator |  | ...by sex - 2012 |
Footnote:
(a) Persons aged 18-24 years.
(b) Formal Education includes School Level Education, Higher Education, Vocational Education, and study for non-school qualification where the level was unable to be determined.
Source:
ABS data available on request, 2008-2012 Surveys of Education and Work |  | 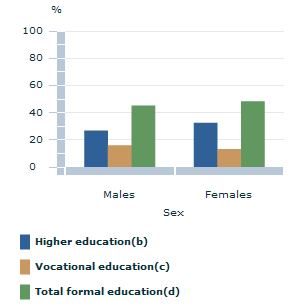
Footnote:
(a) Persons aged 18-24 years.
(b) Higher education includes Postgraduate degrees, Masters degrees, Graduate diplomas, Graduate certificates and Bachelor degrees.
(c) Vocational education includes Advanced diplomas, Diplomas and Certificates I to IV.
(d) Formal education includes School level education, Higher education, Vocational education, and study for non-school qualification where the level was unable to be determined.
Source:
ABS data available on request, 2012 Survey of Education and Work |
 |  |  |
 |  |  |
 |  |  |
...by socioeconomic status - 2012 |  | Preschool participation - 2012 |
Footnote:
(a) Persons aged 18-24 years.
(b) SES is derived using the ABS 2006 SEIFA IRSD (at CD level) disaggregated into quintiles (where 1 is the most disadvantaged and 5 is the least disadvantaged). Low SES represents Quintile 1.
(c) Higher Education includes Postgraduate degrees, Master degrees, Graduate diplomas, Graduate certificates and Bachelor degrees.
(d) Vocational Education includes Advanced diplomas, Diplomas and Certificates I to IV.
(e) Formal Education includes School Level Education, Higher Education, Vocational Education, and study for non-school qualification where the level was unable to be determined.
Source:
ABS data available on request, 2012 Survey of Education and Work |  | 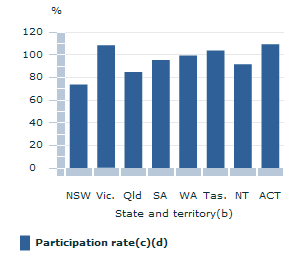
Footnote:
(a) Children aged 4-5 years.
(b) Qld rate uses counts of episodes as counts of children is not available.
(c) Preschool participation rate is the number of preschool students of a particular age expressed as a proportion of the population of the same age.
(d) Some rates may exceed 100%. The age grouping of 4-5 years approximates a single year of preschool enrolment contributing to rates over 100%. Children may also attend preschool programs across years contributing to participation rates over 100%. For further information, see Explanatory notes in ABS Preschool Education, Australia, 2012 (cat. no. 4240.0).
Source:
ABS Preschool Education, Australia, 2012 (cat. no. 4240.0) |
 |  |  |
 |  |  |
 |  |  |
School participation - 2012 |  |  |
Footnote:
(a) Students aged 6-17 years.
(b) ACT rate exceeds 100% largely as a result of NSW residents from surrounding areas enrolling in ACT schools.
(c) Comparisons between jurisdictions may be influenced by differences in school commencement ages.
(d) The school participation rate is the number of school students of a particular age expressed as a proportion of the population of the same age.
(e) Some rates may exceed 100%. For further information, see Explanatory notes in ABS Preschool Education, Australia, 2012 (cat. no. 4240.0).
Source:
ABS Schools, Australia, 2012 (cat. no. 4221.0) |  |  |
 |  | |
 |  |  |
 |  |  |
|
| EMPLOYMENT |
 |
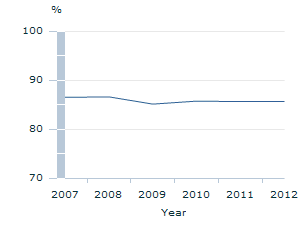
Employment as a proportion of people who are in work or want to work(a)(b) |
 |  |  |
 |  |  |
Progress indicator |  | ...by sex |
Footnote:
(a) Persons aged 15 years and over.
(b) Data is for September.
Source:
ABS data available on request, Persons Not in the Labour Force |  | 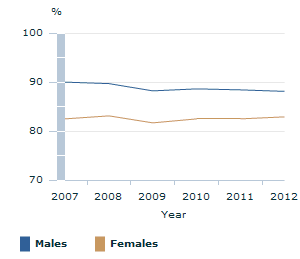
Footnote:
(a) Persons aged 15 years and over.
(b) Data is for September.
Source:
ABS data available on request, Persons Not in the Labour Force |
 |  |  |
 |  |  |
 |  |  |
...by state and territory |  |  |
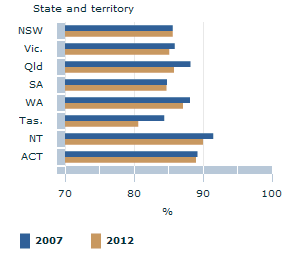
Footnote:
(a) Persons aged 15 years and over.
(b) Data is for September.
Source:
ABS data available on request, Persons Not in the Labour Force |  |  |
 |  | |
 |  |  |
 |  |  |
|
| INCOME |
 |  |  |
Disposable household income for low & middle income households(a) |
 |  |  |
 |  |  |
Progress indicator |  |  |
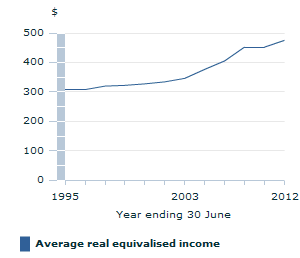
Footnote:
(a) Estimates presented from 2007-08 onwards are not directly comparable with estimates for previous cycles due to the improvements made to measuring income introduced in 2007-08 cycle. Estimates for 2003-04 and 2005-06 have been recompiled to reflect the new treatments of income, however not all components introduced are available to present the years on a comparable basis.
Source:
ABS data available on request, Surveys of Income and Housing |  |  |
 |  | |
|
|
|
|
