|
|
|
This page contains the following further information for health:
|
USEFUL LINKS
ABS Topics @ a Glance - Health
ABS Australian Health Survey
ABS Australian Health Survey: Updated Results, 2011-12 (cat no. 4364.0.55.003)
ABS National Health Survey, 2001 (cat no. 4364.0)
ABS National Health Survey, 2004-05 (cat no. 4364.0)
ABS National Health Survey, 2007-08 (cat no. 4364.0)
ABS Deaths, Australia, 2012 (cat. no. 3302.0)
ABS Private Health Insurance: A snapshot, 2004-05 (cat. no. 4815.0.55.001)
ABS National Nutrition Survey, 1995 (cat no. 4802.0)
ABS National Nutrition Survey: Selected Highlights, Australia, 1995 (cat. no. 4802.0)
ABS Patient Experiences in Australia: Summary of Findings, 2011-12 (cat. no. 4839.0)
Australian Institute of Health and Welfare (AIHW) - Changes in life expectancy and disability in Australia 1998 to 2009 <http://www.aihw.gov.au>
National Sustainability Council 2013 'Sustainable Australia Report 2013, Conversations with the future' <http://www.environment.gov.au/>
|
GLOSSARY
Air quality index
An air quality index (AQI) can be calculated by dividing pollutant concentrations by standards for maximum allowable concentrations set in the National Environment Protection (Ambient Air Quality) Measure (the ‘NEPM’; available at http://www.comlaw.gov.au/Details/C2004H03935) and multiplying by 100. An index score of 66 or less is considered good, while a score greater than 100 is considered poor. The figures used in Measures of Australia's Progress are averaged AQIs of median concentrations for all measured pollutants (carbon dioxide, nitrogen dioxide, ozone, sulfur dioxide, and particle matter).
Measures of Australia's Progress provides an average air quality index for capital cities, weighted by population. This means that each city's AQI contributes to the overall average proportionally relating to its population. For example in 2010, Sydney's population represented 31% of the overall capital city population, and therefore its AQI contributed to almost a third of the overall indicator.
Body Mass Index (BMI)
Body Mass Index (BMI) is a simple index of weight-for-height that is commonly used to classify underweight, normal weight, overweight and obesity. It is calculated from height and weight information, using the formula weight (kg) divided by the square of height (m). To produce a measure of prevalence of underweight, normal weight, overweight or obesity in adults, BMI values are grouped according to the table below which allows categories to be reported against both World Health Organisation (WHO) and the National Health and Medical Research Council (NHMRC) guidelines.
BODY MASS INDEX, Adults
| Category |  | Range |
 |  |  |
 |  |  |
 |  |  |
 |  |  |
| Underweight |  | Less than 18.50 |
| Normal range |  | 18.50 - 24.99 |
| Overweight |  | 25.00 - 29.99 |
| Obese |  | 30.00 or more |
Current daily smoker
A current daily smoker is a respondent who reported at the time of interview that they regularly smoked one or more cigarettes, cigars or pipes per day.
Disability free life expectancy
Disability free life expectancy indicates the length of time people can expect to live without restriction to their day-to-day physical function or activity as a result of disability.
Life expectancy
Life expectancy refers to the average number of additional years a person of a given age and sex might expect to live if the age-specific death rates of the given period continued throughout his/her lifetime.
Life table
A life table is a tabular, numerical representation of mortality and survivorship of a cohort of births at each age of life. The conventional life table is based on the assumption that as the cohort passes through life it experiences mortality at each age in accordance with a predetermined pattern of mortality rates which do not change from year to year. The life table thus constitutes a hypothetical model of mortality, and even though it is usually based upon death rates from a real population during a particular period of time, it does not describe the real mortality which characterises a cohort as it ages.
Due to differences in mortality patterns between males and females at different ages, life tables are generally constructed separately for each sex.
Psychological distress
Derived from the Kessler Psychological Distress Scale (K10). This is a scale of non-specific psychological distress based on 10 questions about negative emotional states in the past 30 days. The K10 is scored from 10 to 50, with higher scores indicating a higher level of distress; low scores indicate a low level of distress. In this publication, scores are grouped as follows:
- Low levels of distress (10-15);
- Moderate levels of distress (16-21);
- High levels of distress (22-29); and
- Very high levels of distress (30-50).
Data was collected from respondents aged 18 years and over.
|
REFERENCES
Australian Government Department of Sustainability, Environment, Water, Population and Communities, 2010, 'State of the Air in Australia: 1999-2008', Canberra, DSEWPaC <http://www.environment.gov.au/>
National Sustainability Council, 2013, 'Sustainable Australia Report 2013, Conversations with the future', Canberra, DSEWPaC <http://www.environment.gov.au/>
State of the Environment 2011 Committee, 2011, 'Australia: State of the environment, 2011', Independent report to the Australian Government Minister for Sustainability, Environment, Water, Population and Communities, Canberra, DSEWPaC <http://www.environment.gov.au/>
|
Click on the links below to be taken to a summary of the graphs from the corresponding tab within the Health theme:
Overall progress?
Physical health
Mental health and wellbeing
Healthy lifestyles
Healthy environments
|
| OVERALL PROGRESS? |
 |
Life expectancy at birth(a) |
 |  |  |
 |  |  |
Headline progress indicator |  |  |

Footnote:
(a) Life expectancy has been calculated using data for the three years ending in the reference year.
Source:
ABS Deaths, Australia, 2012 (cat. no. 3302.0) |  |  |
 |  | |
 |  |  |
 |  |  |
|
| PHYSICAL HEALTH |
 |
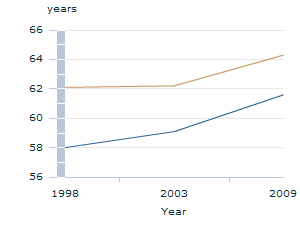
Disability free life expectancy at birth |
 |  |  |
 |  |  |
Progress indicator |  |  |
Source:
Australian Institute of Health and Welfare, Changes in life expectancy and disability in Australia 1998-2009 |  |  |
 |  | |
 |  |  |
 |  |  |
|
| MENTAL HEALTH AND WELLBEING |
 |
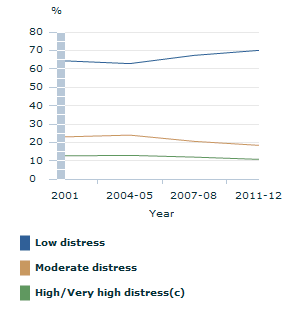
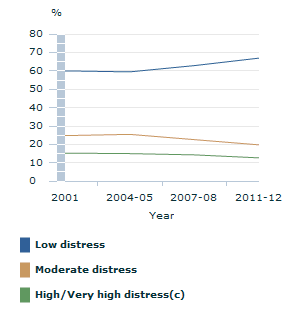
Level of psychological distress(a)(b) |
 |  |  |
 |  |  |
Progress indicator |  | ...for males |
Footnote:
(a) Levels of psychological distress are derived from the Kessler Psychological Distress Scale. Denominator includes a small number of persons for whom levels of psychological distress were unable to be determined or who were not asked.
(b) Persons aged 18 years and over.
(c) A score of 22 or more on the Kessler Psychological Distress Scale (K10).
Source:
ABS National Health Survey (cat no. 4364.0)
ABS Australian Health Survey: Updated Results, 2011-12 (cat no. 4364.0.55.003) |  | 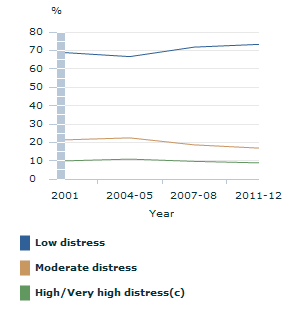
Footnote:
(a) Levels of psychological distress are derived from the Kessler Psychological Distress Scale. Denominator includes a small number of persons for whom levels of psychological distress were unable to be determined or who were not asked.
(b) Persons aged 18 years and over.
(c) A score of 22 or more on the Kessler Psychological Distress Scale (K10).
Source:
ABS National Health Survey (cat no. 4364.0)
ABS Australian Health Survey: Updated Results, 2011-12 (cat no. 4364.0.55.003) |
 |  |  |
 |  |  |
 |  |  |
...for females |  |  |
Footnote:
(a) Levels of psychological distress are derived from the Kessler Psychological Distress Scale. Denominator includes a small number of persons for whom levels of psychological distress were unable to be determined or who were not asked.
(b) Persons aged 18 years and over.
(c) A score of 22 or more on the Kessler Psychological Distress Scale (K10).
Source:
ABS National Health Survey (cat no. 4364.0)
ABS Australian Health Survey: Updated Results, 2011-12 (cat no. 4364.0.55.003) |  |  |
 |  | |
 |  |  |
 |  |  |
|
| HEALTHY LIFESTYLES |
 |  |  |
Healthy lifestyles |
 |  |  |
 |  |  |
Progress indicator - Overweight/obese(a)(b) |  | ...Overweight/obese(a)(b), by age |
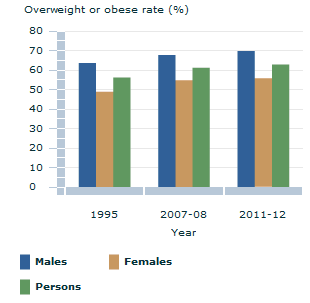
Footnote:
(a) Persons aged 18 years and over.
(b) Based on measured Body Mass Index.
Source:
ABS National Nutrition Survey, 1995 (cat no. 4802.0)
ABS National Health Survey, 2007-08 (cat no. 4364.0)
ABS Australian Health Survey National Health: Updated Results, 2011-12 (cat no. 4364.0.55.003) |  | 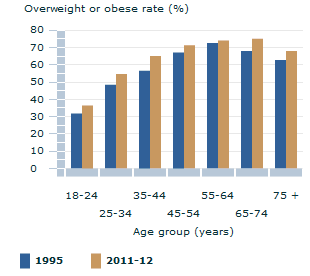
Footnote:
(a) Persons aged 18 years and over.
(b) Based on measured Body Mass Index.
Source:
ABS National Nutrition Survey, 1995 (cat no. 4802.0)
ABS Australian Health Survey National Health: Updated Results, 2011-12 (cat no. 4364.0.55.003) |
 |  |  |
 |  |  |
 |  |  |
Progress indicator - Current daily smoker(a) |  | ...Current daily smoker(a), by age |
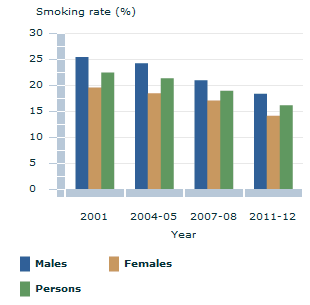
Footnote:
(a) Persons aged 18 years and over.
Source:
ABS National Health Survey, 2001 (cat no. 4364.0)
ABS National Health Survey, 2004-05 (cat no. 4364.0)
ABS National Health Survey, 2007-08 (cat no. 4364.0)
ABS Australian Health Survey: Updated Results, 2011-12 (cat no. 4364.0.55.003) |  | 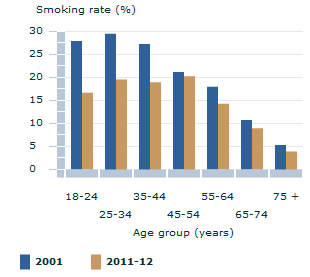
Footnote:
(a) Persons aged 18 years and over.
Source:
ABS National Health Survey, 2001 (cat no. 4364.0)
ABS Australian Health Survey: Updated Results, 2011-12 (cat no. 4364.0.55.003) |
 |  | |
 |  |  |
 |  |  |
|
| HEALTHY ENVIRONMENTS |
 |  |  |
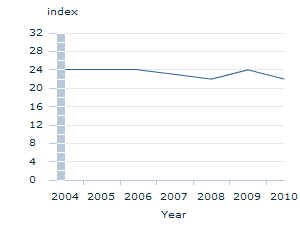
Average air quality index(a) of capital cities(b) |
 |  |  |
 |  |  |
Progress indicator |  |  |
Footnote:
(a) An average air quality index (AQI) of 100 or greater means that on average air quality standards have been exceeded. An AQI of 33 or less is considered very good.
(b)This indicator takes the average AQI for all measured pollutants within each city, based on median concentrations, and brings them together as an overall average that is weighted by the cities' relative populations.
Source:
National Sustainability Council, 'Sustainable Australia Report 2013, Conversations with the future', Canberra, DSEWPaC, 2013.
ABS Population by Age and Sex, Regions of Australia, 2012 (cat. no. 3235.0) |  |  |
 |  | |
 |  |  |
 |  |  |
|
|
|
|